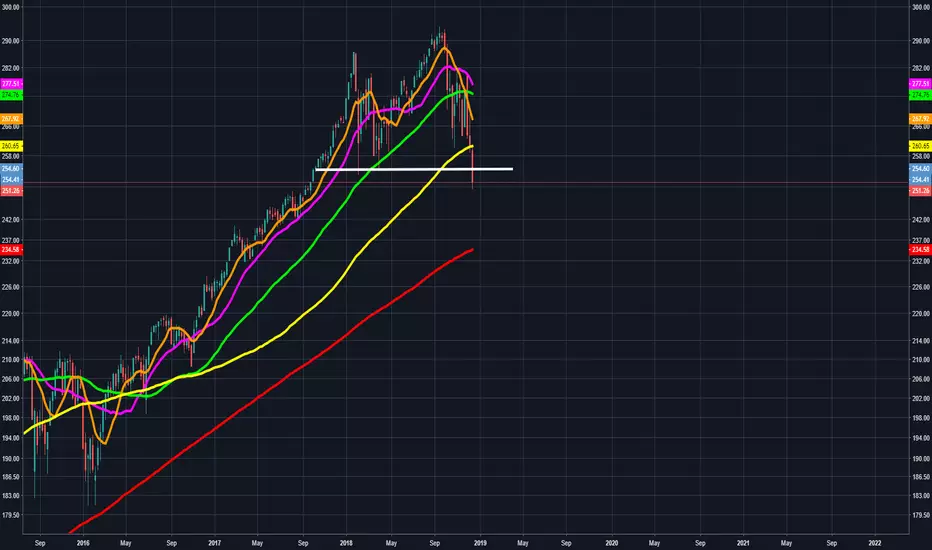
SPY just broke the 100 weekly moving average and has broken below a previous support level as shown by the white line around 254-255 that had held the price back in February and April. I suspect it will retest the 200 weekly MA around 234-235 which is approximately a 6-7% drop. If the 200 weekly MA does not hold, we could be setting up for a longer-term recession as we enter into 2019.
Moving average guide (all weekly for this chart):
10 MA in orange
20 MA in pink
50 MA in green
100 MA in yellow
200 MA in red.
Moving average guide (all weekly for this chart):
10 MA in orange
20 MA in pink
50 MA in green
100 MA in yellow
200 MA in red.
註釋
Coming down as expected: 註釋
Getting closer: 交易結束:目標達成
Target hit around 234-235: FTX US: ftx.us/
Sign up for Binance US here: binance.us/?ref=35000668
Sign up for Binance US here: binance.us/?ref=35000668
免責聲明
這些資訊和出版物並不意味著也不構成TradingView提供或認可的金融、投資、交易或其他類型的意見或建議。請在使用條款閱讀更多資訊。
FTX US: ftx.us/
Sign up for Binance US here: binance.us/?ref=35000668
Sign up for Binance US here: binance.us/?ref=35000668
免責聲明
這些資訊和出版物並不意味著也不構成TradingView提供或認可的金融、投資、交易或其他類型的意見或建議。請在使用條款閱讀更多資訊。