Big week here. Rarely do you get big banks and big tech earnings on the same week..
Jpm, Goldman sach, and JNJ are dow jones heavy weights.
This is important because I think Dow will close that gap at 44,850 and most likely retest ATH at around 45,000.

As long as dow closes above 44,200 Monday, they will do this move

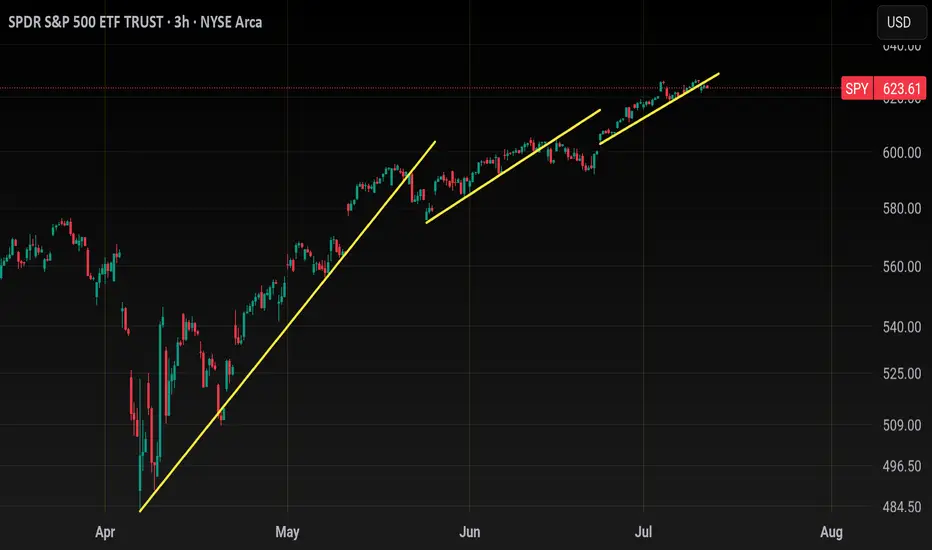
Now logically you have to ask yourself, If Dow jones moves 800pts or 2% what will spy do?
Well unless Nasdaq gives it all up early in the week then Spy will grind higher..
 QQQ
QQQ
2hour chart is mimicking
June's price action

Even similar bearish Divergence on RSI

So will tech Roll over this week?
TSM and NFLX both reporting..
Qqq 30min price action, as long as price holds above 548.50 I wouldn't short this at all

As you can see with the yellow channel price will be range trading between 551-555. Over 558 and 560 comes.. below 548 and 544 comes.
This is actionable trading, I know some of you want a bigger picture on the short side but until we break below the 20sma I really don't like going full bear at the beginning of earning season...
Yes, alot of things are flashing red signaling a major correction is looming , for Example here's XLC. This is the sector of NFLX and
  META
META
Here's the weekly chart and RSI


Very bearish bigger picture here, I could easily see this sector and the big names inside it going back to April lows
But then You have XLY
XLY
The sector of AMZN and
  TSLA
TSLA

Nothing is bearish Herr and as long as it holds 217 they are going to push this back to ATH.
AMZN chart is completely identical

So let's say NFLX and Meta have down days similar to last Friday but Amzn and Tsla pumps then you will get a small pullback unless the chipsector dumps also 😉. Remember there's always a bull in the market, they'll just rotate into something less overbought..
Only time you really see majority selling off is when there is a catalyst (Carry trade, tariffs) or Seasonality (March, Sept)..
So I'm bearish on Chips SMH and I'm bearish on
  XLC but you have to be selective..
I wouldn't short
TSLA
AMZN
 GOOGL
GOOGL
 AAPL
AAPL
Those stocks will likely outperform this Quarter.
As far as the banks earnings , even if they pop, I think this will be a sell the news event and this sector XLF (Big banks) is headed for a massive correction

The Small banks KRE
KRE
Have almost completed their V shape recovery and will most likely correct after this week

Daily technicals are overbought similar to IWM but the weekly is where you see caution
Top of weekly Bollingerband always leads to a major sell the following week

SPY
15min chart
I'm bullish early in the week, I think they will buy the dip ahead of earnings so if they open up near Friday's low or the 15min 200sma they could buy it there, below 621 and they will go for the gap close at 620; that will be another dip buy opportunity . Stop loss 619.00

Below 619.00 and they have a gap left open at 614.84 to close. Stop loss 15min 200ma

Trade Idea of the week isGOOGL
Bullish ascending triangle forming under 182.00 resistance.. Price may breakout this week

4hour chart Friday finished with a Shooting star so we could start the week with a pullback but I think googl will hold 177.00 support and that's a good entry for a long.. or wait for conformation which would be a break above 182.00..

So 177 or 182 is my entry
Googl is only bearish below 172.00 or 200ma
Personal opinion This administration Has promised 200 trade deals and have gotten only 3 so far. As we get closer and closer to August investors will get nervous and I think we will see another major sell! He's has kicked the tariff can down the road as far as it can go and still these countries are calling his bluff. Becareful because I think the next time trump won't fold
Jpm, Goldman sach, and JNJ are dow jones heavy weights.
This is important because I think Dow will close that gap at 44,850 and most likely retest ATH at around 45,000.
As long as dow closes above 44,200 Monday, they will do this move
Now logically you have to ask yourself, If Dow jones moves 800pts or 2% what will spy do?
Well unless Nasdaq gives it all up early in the week then Spy will grind higher..
2hour chart is mimicking
June's price action
Even similar bearish Divergence on RSI
So will tech Roll over this week?
TSM and NFLX both reporting..
Qqq 30min price action, as long as price holds above 548.50 I wouldn't short this at all
As you can see with the yellow channel price will be range trading between 551-555. Over 558 and 560 comes.. below 548 and 544 comes.
This is actionable trading, I know some of you want a bigger picture on the short side but until we break below the 20sma I really don't like going full bear at the beginning of earning season...
Yes, alot of things are flashing red signaling a major correction is looming , for Example here's XLC. This is the sector of
Here's the weekly chart and RSI
Very bearish bigger picture here, I could easily see this sector and the big names inside it going back to April lows
But then You have
The sector of
Nothing is bearish Herr and as long as it holds 217 they are going to push this back to ATH.
So let's say NFLX and Meta have down days similar to last Friday but Amzn and Tsla pumps then you will get a small pullback unless the chipsector dumps also 😉. Remember there's always a bull in the market, they'll just rotate into something less overbought..
Only time you really see majority selling off is when there is a catalyst (Carry trade, tariffs) or Seasonality (March, Sept)..
So I'm bearish on Chips
I wouldn't short
Those stocks will likely outperform this Quarter.
As far as the banks earnings , even if they pop, I think this will be a sell the news event and this sector
The Small banks
Have almost completed their V shape recovery and will most likely correct after this week
Daily technicals are overbought similar to IWM but the weekly is where you see caution
Top of weekly Bollingerband always leads to a major sell the following week
15min chart
I'm bullish early in the week, I think they will buy the dip ahead of earnings so if they open up near Friday's low or the 15min 200sma they could buy it there, below 621 and they will go for the gap close at 620; that will be another dip buy opportunity . Stop loss 619.00
Below 619.00 and they have a gap left open at 614.84 to close. Stop loss 15min 200ma
Trade Idea of the week is
Bullish ascending triangle forming under 182.00 resistance.. Price may breakout this week
4hour chart Friday finished with a Shooting star so we could start the week with a pullback but I think googl will hold 177.00 support and that's a good entry for a long.. or wait for conformation which would be a break above 182.00..
So 177 or 182 is my entry
Googl is only bearish below 172.00 or 200ma
Personal opinion This administration Has promised 200 trade deals and have gotten only 3 so far. As we get closer and closer to August investors will get nervous and I think we will see another major sell! He's has kicked the tariff can down the road as far as it can go and still these countries are calling his bluff. Becareful because I think the next time trump won't fold
免責聲明
這些資訊和出版物並不意味著也不構成TradingView提供或認可的金融、投資、交易或其他類型的意見或建議。請在使用條款閱讀更多資訊。
免責聲明
這些資訊和出版物並不意味著也不構成TradingView提供或認可的金融、投資、交易或其他類型的意見或建議。請在使用條款閱讀更多資訊。