#STEEM / BTC ( Binance, Bittrex )
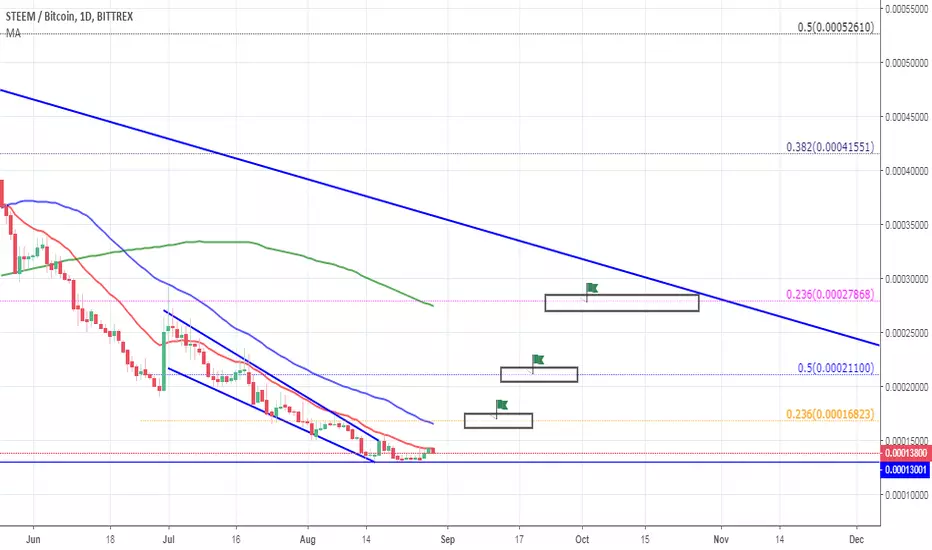
Buy Range : 0.000133-0.000136
Stop Loss : Not recommend
Target 1 : 0.000164
Target 2 : 0.000211
Target 3 : 0.000270
WEEKLY CHART

- RSI on lowest point in two years and near oversold zone ( positive )
- Negative SAR ( Negative )
- Below moving averages ( Negative )
- Lack of volume ( Negative )
DAILY CHART

- SAR was positive in the last four days ( positive )
- Falling Wedge pattern has been broken ( positive )
- Sideways accumulation after bloodbath ( positive )
- RSI dontrend broken after touched oversold zone ( positive )
- MACD showing some strenght in the last days ( positive )
- CCI has turned into green ( positive )
- CMF is has been performing good in the last two weeks ( Positive )
- Lack of powerfull volume ( Negative )
- Below moving averages ( Negative )
4H CHART

- EMA20/MA50 crossed and support candles ( Positive )
- MACD is falling after first little pump ( negative )
- Ichimoku cloud hasnt been broken twice and still below it ( negative )
- Below MA200 ( negative )
CONCLUSION
After massive bloodbath , Steem has broken its falling wedge and is throwing some early positive indicators which looks interesant to make an investiment. Also, some important facts like price and historic base support zone can suggest we are near of the bottom.
On the other side, there are some negative indicators which cant confirm bullish reversal yet. If altcoin market continue performing good we could have first good movements in this nice coin.
Stay safe,
Mike
Buy Range : 0.000133-0.000136
Stop Loss : Not recommend
Target 1 : 0.000164
Target 2 : 0.000211
Target 3 : 0.000270
WEEKLY CHART
- RSI on lowest point in two years and near oversold zone ( positive )
- Negative SAR ( Negative )
- Below moving averages ( Negative )
- Lack of volume ( Negative )
DAILY CHART
- SAR was positive in the last four days ( positive )
- Falling Wedge pattern has been broken ( positive )
- Sideways accumulation after bloodbath ( positive )
- RSI dontrend broken after touched oversold zone ( positive )
- MACD showing some strenght in the last days ( positive )
- CCI has turned into green ( positive )
- CMF is has been performing good in the last two weeks ( Positive )
- Lack of powerfull volume ( Negative )
- Below moving averages ( Negative )
4H CHART
- EMA20/MA50 crossed and support candles ( Positive )
- MACD is falling after first little pump ( negative )
- Ichimoku cloud hasnt been broken twice and still below it ( negative )
- Below MA200 ( negative )
CONCLUSION
After massive bloodbath , Steem has broken its falling wedge and is throwing some early positive indicators which looks interesant to make an investiment. Also, some important facts like price and historic base support zone can suggest we are near of the bottom.
On the other side, there are some negative indicators which cant confirm bullish reversal yet. If altcoin market continue performing good we could have first good movements in this nice coin.
Stay safe,
Mike
免責聲明
這些資訊和出版物並不意味著也不構成TradingView提供或認可的金融、投資、交易或其他類型的意見或建議。請在使用條款閱讀更多資訊。
免責聲明
這些資訊和出版物並不意味著也不構成TradingView提供或認可的金融、投資、交易或其他類型的意見或建議。請在使用條款閱讀更多資訊。