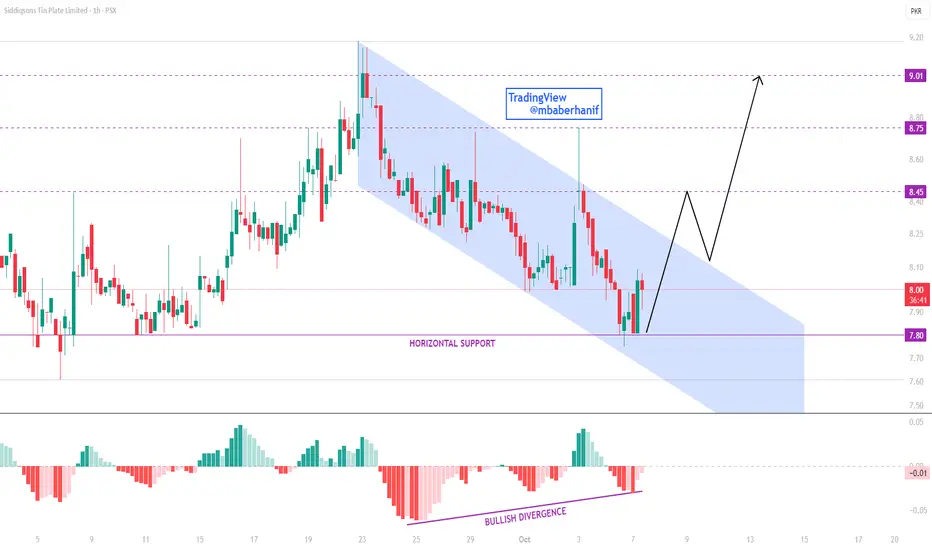
STPL is showing signs of a potential reversal as the price pulls back from the horizontal support around 7.80, simultaneously touching the lower boundary of the descending parallel channel. A bullish divergence is visible on the MACD histogram, indicating that selling momentum is weakening and buyers are likely to regain control.
If the price successfully breaks above the parallel channel, it could trigger the next bullish wave. Upside targets are set at 8.45, 8.75, and 9.01, respectively.
If the price successfully breaks above the parallel channel, it could trigger the next bullish wave. Upside targets are set at 8.45, 8.75, and 9.01, respectively.
交易結束:目標達成
免責聲明
這些資訊和出版物並非旨在提供,也不構成TradingView提供或認可的任何形式的財務、投資、交易或其他類型的建議或推薦。請閱讀使用條款以了解更多資訊。
免責聲明
這些資訊和出版物並非旨在提供,也不構成TradingView提供或認可的任何形式的財務、投資、交易或其他類型的建議或推薦。請閱讀使用條款以了解更多資訊。