Yello Paradisers! Are we about to witness a powerful breakout of #STX, or is a trap lurking right under our feet? Let's decode this #STXUSDT setup before it’s too late:
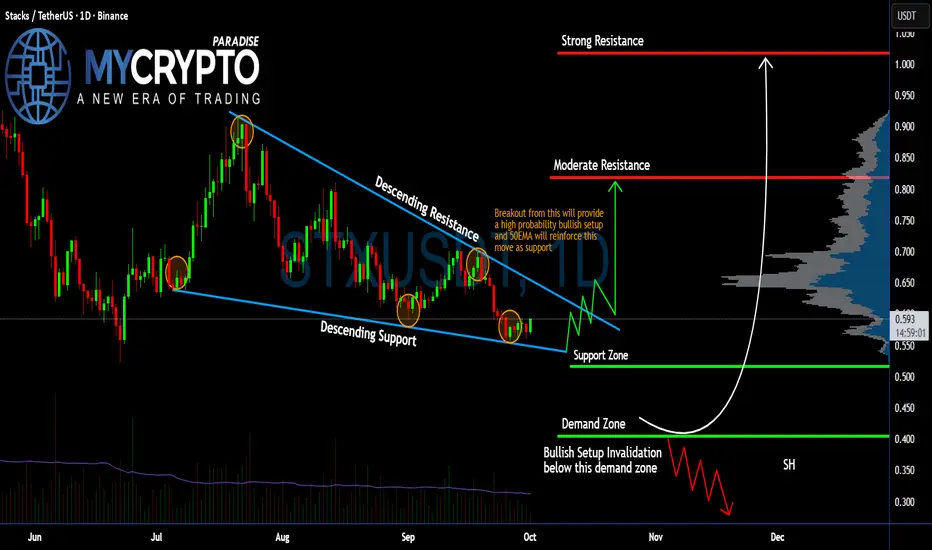
💎#Stacks has been stuck in a clear falling wedge on the daily timeframe by consistently respecting both the descending resistance and descending support lines since late July. Price action is now compressing near the lower end of this structure, showing signs of potential accumulation.
💎Right now, #STXUSD is trading around $0.59, sitting just above the support zone at $0.51, and not far above the final demand zone at $0.40. This area is crucial. As long as bulls defend this zone, the structure remains intact and the bullish scenario is valid.
💎A confirmed breakout above the descending resistance, ideally with a retest of that line alongside support from the 50EMA, would flip this into a high-probability bullish setup. If that happens, we’ll first be targeting the moderate resistance at $0.818. A sustained move above $0.818 opens the door toward the strong resistance at $1.018. That’s your upside target, but only if we break the descending channel cleanly.
💎However, a break below $0.40 would invalidate this entire bullish structure. If this demand zone fails, the setup is broken, and the market could go on to sweep the lower liquidity zones, likely toward $0.30 and below. That’s where over-leveraged bulls will get wiped out.
Strive for consistency, wait for clear confirmations, and remember that discipline always beats chasing quick profits.
MyCryptoParadise
iFeel the success🌴
Want to trade like a PRO without the 15+ year learning curve?
🫳Steal the edge - follow seasoned team of traders at mycryptoparadise.com (FREE)
✅🎖️Or go full throttle with PRO strategy + killer entry/exit signals - t.me/MCPsupportbot
🫳Steal the edge - follow seasoned team of traders at mycryptoparadise.com (FREE)
✅🎖️Or go full throttle with PRO strategy + killer entry/exit signals - t.me/MCPsupportbot
免責聲明
這些資訊和出版物並不意味著也不構成TradingView提供或認可的金融、投資、交易或其他類型的意見或建議。請在使用條款閱讀更多資訊。