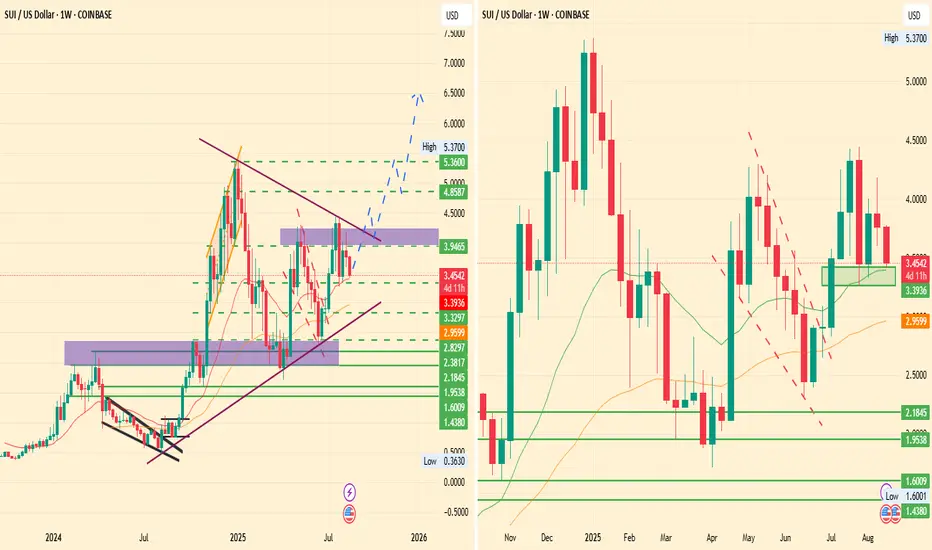
In the current quarter, July brought bullish demand, where this symmetrical pattern played its role on the weekly chart as the SUI price USD reflected a sharp rise from the lower border of this triangle to the upper edge, marking a 90% surge from $2.29 to $4.42.
Yet, August brought a pullback toward a key support level near $3.32. If this zone holds and bullish demand steps in, analysts anticipate a retest of the upper border of the pattern.
A successful breakout could send the SUI price forecast toward $5.37 in the coming weeks.
this retest in Q3 will be followed by an extended rally toward the $6.6 to $7.0 region in Q4 2025.
免責聲明
這些資訊和出版物並不意味著也不構成TradingView提供或認可的金融、投資、交易或其他類型的意見或建議。請在使用條款閱讀更多資訊。
免責聲明
這些資訊和出版物並不意味著也不構成TradingView提供或認可的金融、投資、交易或其他類型的意見或建議。請在使用條款閱讀更多資訊。