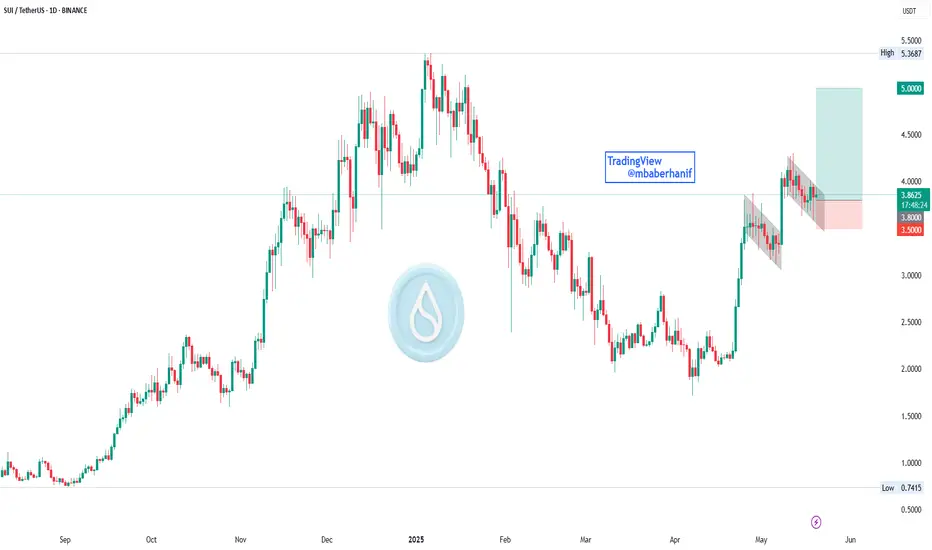
SUI shows a strong upward trend that began in April 2025, following a prolonged downtrend from January to March. The recent price action forms a bullish flag pattern—characterized by consolidation within parallel downward-sloping channels—signaling a continuation of the previous uptrend. The chart highlights two such bullish flags, with the most recent breakout occurring near the $3.80 level. A long trade setup is illustrated, with a stop-loss around $3.50 and a take-profit target near $5.00. This setup suggests a favorable risk-to-reward ratio and implies bullish sentiment as the asset attempts to resume its uptrend, aiming to break past prior resistance levels.
免責聲明
這些資訊和出版物並不意味著也不構成TradingView提供或認可的金融、投資、交易或其他類型的意見或建議。請在使用條款閱讀更多資訊。
免責聲明
這些資訊和出版物並不意味著也不構成TradingView提供或認可的金融、投資、交易或其他類型的意見或建議。請在使用條款閱讀更多資訊。
