On the weekly we are seeing some expansion of the bollinger mass in 3dwave pm heat map indicator. CCI is high, wave-pm is indicating very high levels of compression on all lengths
On the daily wave-pm is showing compression. 3D Wave-pm heat map is showing strength in these bollingers for support for price.
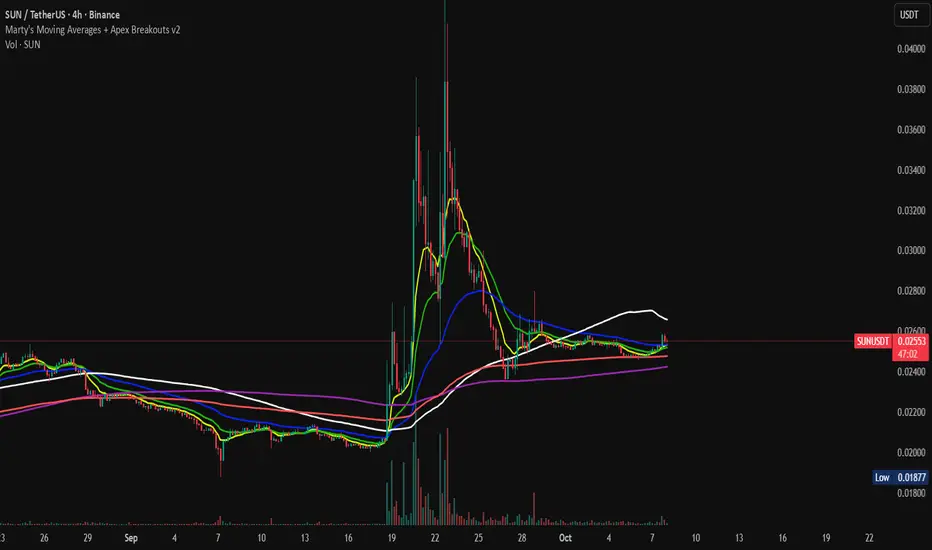
On the lower timeframe, 4hr we are seeing a range and massive compression on 3D Wave-PM indicated by all the blue. Within the green range we are seeing the micro beginnings of an expansion.
CryptoCheck Education / Buy & Sell Alerts
Trading Group 5 day FREE trial >>> discord.gg/jJG5EYA
More Info >>> thecryptocheck.com
Trading Group 5 day FREE trial >>> discord.gg/jJG5EYA
More Info >>> thecryptocheck.com
相關出版品
免責聲明
這些資訊和出版物並不意味著也不構成TradingView提供或認可的金融、投資、交易或其他類型的意見或建議。請在使用條款閱讀更多資訊。
CryptoCheck Education / Buy & Sell Alerts
Trading Group 5 day FREE trial >>> discord.gg/jJG5EYA
More Info >>> thecryptocheck.com
Trading Group 5 day FREE trial >>> discord.gg/jJG5EYA
More Info >>> thecryptocheck.com
相關出版品
免責聲明
這些資訊和出版物並不意味著也不構成TradingView提供或認可的金融、投資、交易或其他類型的意見或建議。請在使用條款閱讀更多資訊。