Chart Analysis (Study Purpose Only):
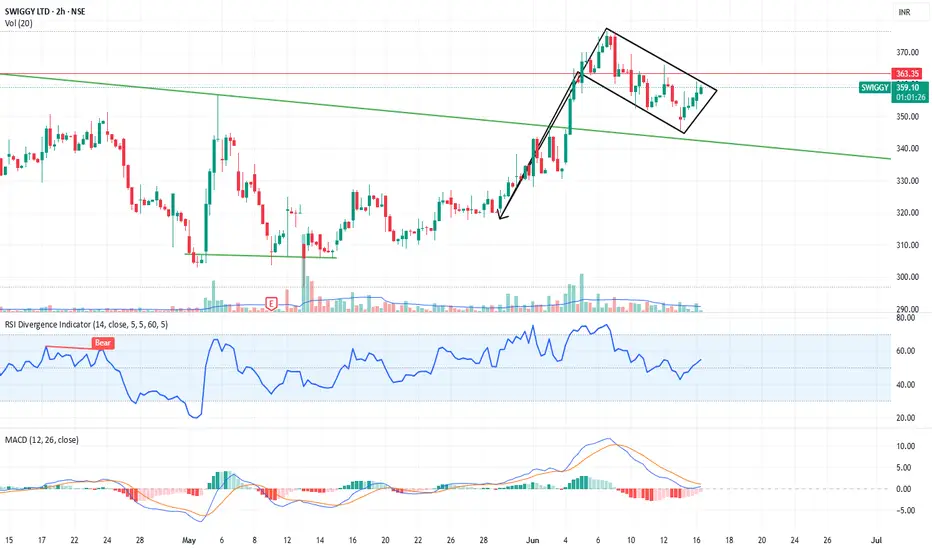
Pattern Observed: After a sharp uptrend, the stock has formed a falling channel (bullish flag) — which typically signals a continuation of the trend.
Support/Resistance:
The price is consolidating above a long-term trendline resistance, which is now acting as support.
Resistance zone is near ₹365–₹367, and support is around the ₹340–₹345 range.
Indicators:
RSI is currently at ~60, suggesting mild bullish momentum without being overbought.
MACD is in a bearish crossover but appears to be flattening, possibly preparing for a bullish crossover.
Volume: Declining volume during the pullback suggests weak selling pressure, often a bullish sign in continuation patterns.
🟢 A breakout above the upper channel with volume could confirm a bullish continuation.
免責聲明
這些資訊和出版物並不意味著也不構成TradingView提供或認可的金融、投資、交易或其他類型的意見或建議。請在使用條款閱讀更多資訊。