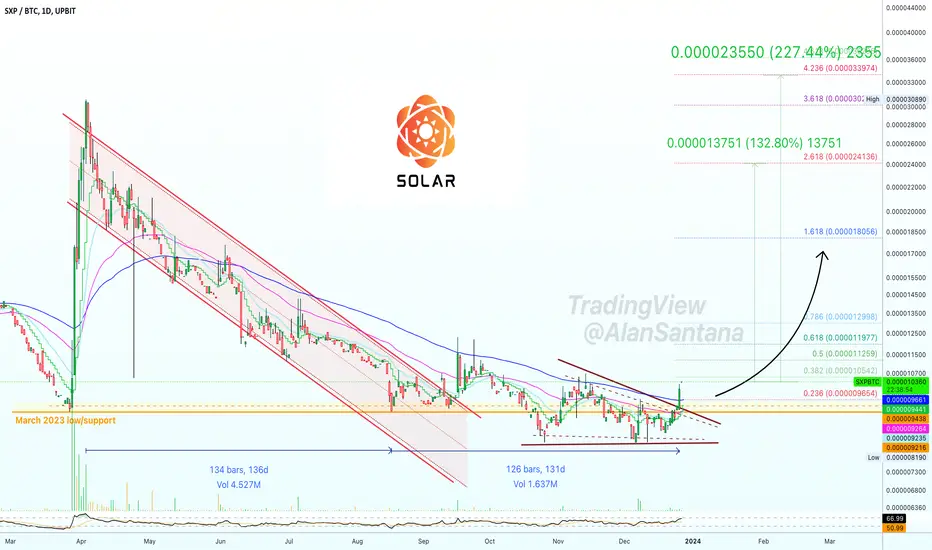
The main and most important signal to consider here is the orange line on the chart. This line marks the March 2023 low/support. When Solar moved below this level, it was in extremely bearish territory, now that it is trading above this level it becomes strongly bullish.
Let's keep it ultra simple shall we?
➖ SXPBTC closed the last session above EMA100, which means that medium-term growth potential (1-3 months) is now confirmed. This is supported by a strong RSI.
➖ We have 136 days of correction; We have 131 days of consolidation.
We can expect a few months of growth in the least.
Here I am mapping some easy targets, but the wave peak can be much more higher than what is shown on this chart. Please keep this in mind.
Do what you need to do to maximize profits and minimize risk.
Thank you for reading.
👉 Each chart/pair/project needs to be considered separately at this point in time. This is very important. One can go up while another one goes down.
Namaste.
🚨 Get the FULL (6-in-1) PREMIUM PACKAGE
lamatrades.com —Since 2017
🚨 TOP Results: ZEC +2736% · ETH +2150%, CRO +1272%, AAVE +1134%, DOGS +868%, SOL +861%, XRP +749%, BTC +580%
More 👉 t.me/masteranandatrades/6681
lamatrades.com —Since 2017
🚨 TOP Results: ZEC +2736% · ETH +2150%, CRO +1272%, AAVE +1134%, DOGS +868%, SOL +861%, XRP +749%, BTC +580%
More 👉 t.me/masteranandatrades/6681
相關出版品
免責聲明
The information and publications are not meant to be, and do not constitute, financial, investment, trading, or other types of advice or recommendations supplied or endorsed by TradingView. Read more in the Terms of Use.