Price Action:
Trend Structure
• Long-term uptrend intact with a higher lows pattern since March 2025
• Strong momentum breakout above key resistance at 1,000 levels
• Price action showing bullish continuation after brief consolidation
• Current trading above all major moving averages (20, 50, 200 EMA)
Breakout Characteristics
• Clean breakout above resistance
• Volume expansion confirming institutional participation
• No immediate rejection at breakout level, suggesting strength
• Momentum favouring further upside continuation
Volume Spread Analysis:
Volume Pattern:
• Significant volume spike during the breakout phase in July 2025
• Volume contraction during handle formation (typical healthy pattern)
• Above-average volumes during cup formation, indicating accumulation
• Recent volume expansion suggests institutional buying interest
Volume Confirmation:
• Breakout supported by 2-3x average daily volume
• Previous resistance turning into support with volume backing
• Accumulation-distribution pattern favourable for continued upside
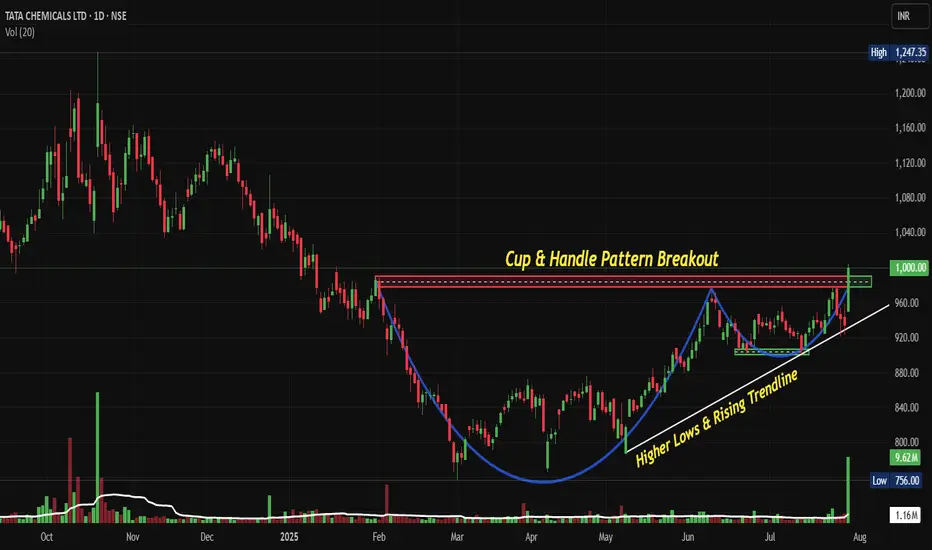
Chart Pattern:
• The chart displays a classic Cup and Handle pattern formation spanning from Jan 2025 to July 2025
• The "Cup" formation shows a rounded bottom with the low around 750-780 levels during March 2025
• The "Handle" represents the consolidation phase between June-July 2025, around 920-960 levels
• Clear breakout above the 1,000 resistance level with strong volume confirmation
Key Technical Levels
• Primary Support: 920-950 (handle low and recent consolidation)
• Secondary Support: 850-880 (mid-cup level)
• Major Support: 750-780 (cup bottom)
• Immediate Resistance: 1,050-1,080 (psychological levels)
• Target Resistance: 1,200-1,250 (measured move from cup depth)
Trade Setup and Strategy:
Entry Levels:
• Aggressive Entry: 1,000-1,020 (on breakout confirmation)
• Conservative Entry: 950-980 (on pullback to handle support)
• Scale-in Entry: 920-950 (major support retest)
Exit Levels:
• Target 1: 1,100-1,120 (initial resistance cluster)
• Target 2: 1,200-1,250 (measured move target)
• Target 3: 1,300-1,350 (extension target based on cup depth)
Stop-Loss Strategy:
• Initial Stop-Loss: 920 (below handle low)
• Trailing Stop: 950 after Target 1 achievement
• Risk-Reward Ratio: 1:3 to 1:4 on conservative entry
Position Sizing and Risk Management:
Position Sizing:
• Allocate 2-3% of portfolio for this trade
• Calculate position size based on stop-loss distance
• Consider scaling in approach for better average entry
Risk Management:
• Maximum risk per trade: 1-2% of total capital
• Use position sizing formula: Risk Amount ÷ (Entry - Stop Loss)
• Maintain diversification across sectors and market caps
Risk Factors:
• Broader market correction could impact individual stock performance
• Sector-specific headwinds in the chemicals industry
• Global economic slowdown affecting demand
Fundamental and Sectoral Backdrop:
Recent Financial Performance:
• Q1 FY26 results showed consolidated revenue of ₹3,719 Cr with EBITDA of ₹649 Cr and PAT of ₹316 Cr
• Standalone revenue at ₹1,169 Cr, up 11.65% compared to Q1FY25, with PAT of ₹307 Cr, up 20%
• Stock gained 16.66% over the last three months
• Strong operational performance supporting technical breakout
Sectoral Outlook:
• The Chemicals market in India is projected to grow by 3.46% (2025-2029), resulting in a market volume of US$35.4bn in 2029
• India's speciality chemicals market is expected to increase at a CAGR of 12% to US$64 billion by 2025
• The chemical industry, currently valued at around US$250 billion, aims to grow to US$300 billion by 2025
• The sector is projected to grow by 11 to 12 per cent during 2021–27, tripling its global market share by 2040
Investment Thesis:
• Strong sectoral tailwinds supporting long-term growth
• Company's positioning in the speciality chemicals segment
• Potential beneficiary of India's manufacturing growth story
• Technical breakout aligning with fundamental strength
Key Monitoring Points:
Technical Triggers:
• Sustain above 1,000 levels for breakout confirmation
• Volume patterns on any pullbacks
• Price action at target levels for profit booking decisions
Fundamental Catalysts:
• Quarterly earnings performance and guidance
• New project announcements or capacity expansions
• Sectoral policy developments and government initiatives
• Global chemical prices and demand trends
Risk Monitoring:
• A break below 920 levels would invalidate the bullish setup
• Broader market sentiment and global risk-off scenarios
• Sector rotation away from chemicals and industrials
• Company-specific news flow and management commentary
My Take:
The combination of technical breakout, strong fundamentals, and positive sector outlook makes
Keep in the Watchlist and DOYR.
NO RECO. For Buy/Sell.
📌Thank you for exploring my idea! I hope you found it valuable.
🙏FOLLOW for more
👍BOOST if you found it useful.
✍️COMMENT below with your views.
Meanwhile, check out my other stock ideas on the right side until this trade is activated. I would love your feedback.
Disclaimer: "I am not a SEBI REGISTERED RESEARCH ANALYST AND INVESTMENT ADVISER."
This analysis is intended solely for informational and educational purposes and should not be interpreted as financial advice. It is advisable to consult a qualified financial advisor or conduct thorough research before making investment decisions.
相關出版品
免責聲明
這些資訊和出版物並非旨在提供,也不構成TradingView提供或認可的任何形式的財務、投資、交易或其他類型的建議或推薦。請閱讀使用條款以了解更多資訊。