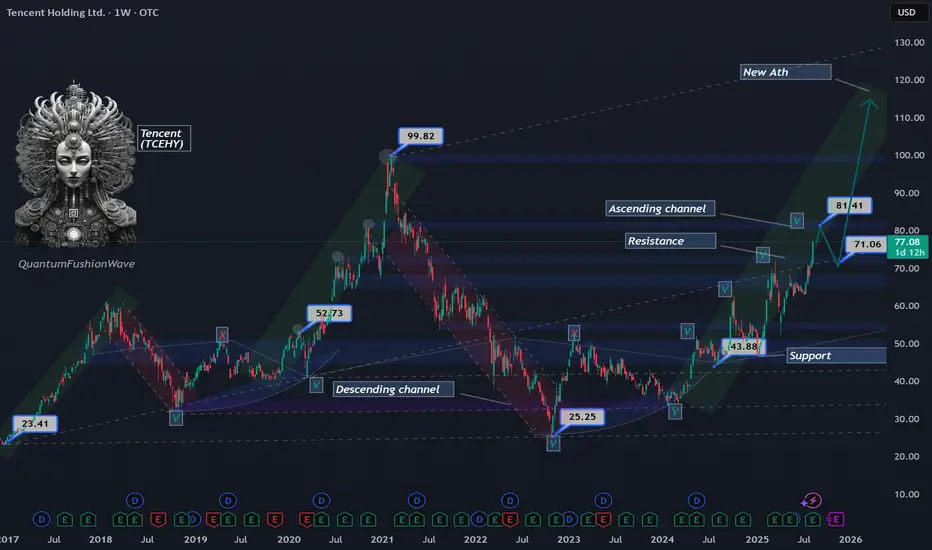
Tencent Holdings Ltd. (TCEHY) is trading around $77 and approaching a critical resistance zone at $81. A clean breakout above $81 would open the path for price to challenge its previous all-time highs, signaling strong continuation within its bullish structure.
However, $81 also aligns with a key historical resistance from November 2020, making it a level to watch for potential rejection. If price fails to break through, a retracement toward the $71 support zone could unfold, providing a healthy reset within the broader uptrend.
Should the $71 area hold as support and buying momentum resume, Tencent could mount a rally toward the $100 mark, reinforcing its longer-term bullish channel.
Key levels to watch:
Resistance: $81 (critical breakout level)
Support: $71 (retracement target)
Upside target: $100 if bullish momentum continues
免責聲明
這些資訊和出版物並不意味著也不構成TradingView提供或認可的金融、投資、交易或其他類型的意見或建議。請在使用條款閱讀更多資訊。
免責聲明
這些資訊和出版物並不意味著也不構成TradingView提供或認可的金融、投資、交易或其他類型的意見或建議。請在使用條款閱讀更多資訊。