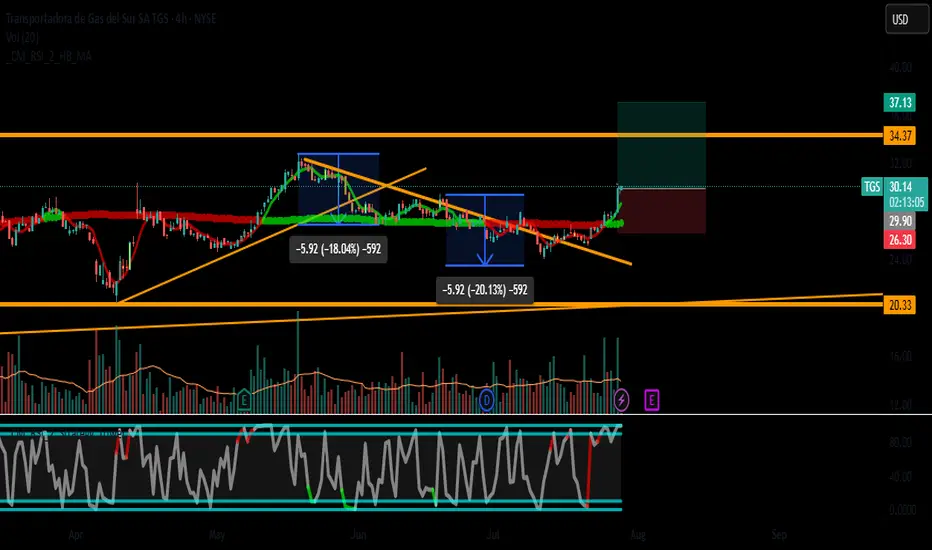
TGS (TGS Ltd.) – Breakout Play with Strong Upside Potential

🚀 Trade Idea: TGS (TGS Ltd.) – Breakout Play with Strong Upside Potential
📈 Entry: $29.90 (Breakout above resistance)
🛑 Stop Loss: $26.30 (Below key support & SMA-50)
🎯 Take Profit: $37.13 (~24% upside, near next resistance zone)
📊 Risk-Reward Ratio: 1:3 (Favorable setup)
🔍 Analysis Breakdown
📊 Technical Setup
Trend: Daily trend is consolidating, but 4H/1H show bullish momentum.
Key Levels:
Support: $26.30 (SMA-50 & recent swing low).
Resistance: $30 (psychological level, previous highs).
Indicators:
MACD (4H): Bullish crossover, supporting upside.
RSI (Daily): ~65 (neutral, no overbought signal yet).
Volume: Increasing on upward moves (confirms interest).
💰 Fundamental Backing
Strong Revenue & Earnings Growth (See previous analysis).
Undervalued Metrics (P/B, P/S) suggest room for expansion.
Low Debt (Score: 10/10) reduces downside risk.
🎯 Why This Trade?
✅ Breakout Play: A close above $30 confirms bullish continuation.
✅ Strong Fundamentals: Earnings growth supports higher valuation.
✅ Low-Risk Entry: Tight stop below support.
⚠️ Key Risks:
Failure to hold $30 could lead to retest of $26.30.
Market-wide pullback could delay momentum.
📉 Trade Management
Add-on: Consider scaling in above $31.50 (confirmation of trend).
Trailing Stop: Move SL to $28.50 after hitting $33.
📌 Final Thought: TGS has strong upside potential if it breaks $30. The 1:3 R/R makes this a high-conviction trade.
👨💻 Let me know your thoughts in the comments!
#TGS #Breakout #Stocks #Trading #Investing
Disclaimer: Not financial advice. Do your own research before trading.
免責聲明
這些資訊和出版物並不意味著也不構成TradingView提供或認可的金融、投資、交易或其他類型的意見或建議。請在使用條款閱讀更多資訊。
免責聲明
這些資訊和出版物並不意味著也不構成TradingView提供或認可的金融、投資、交易或其他類型的意見或建議。請在使用條款閱讀更多資訊。