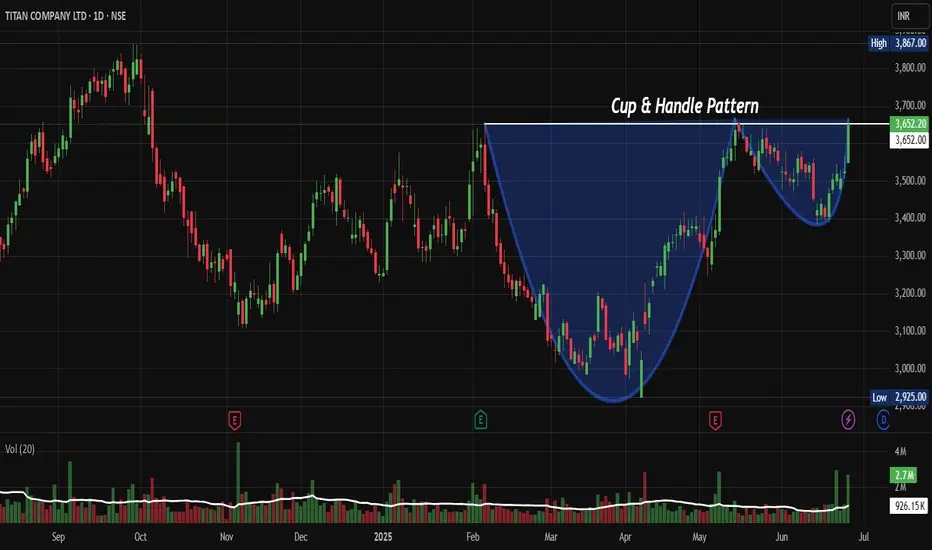
Price Action Analysis:
• Stock has formed a classic Cup & Handle pattern over an 8-month period from February 2025 to June 2025
• Cup formation shows a rounded bottom with depth of approximately 800 points (3,700 to 2,900 levels)
• Handle formation displays controlled consolidation with lower volatility, indicating institutional accumulation
• Price action demonstrates strong momentum with a 3.58% daily gain and healthy volume expansion
Volume Spread Analysis:
• Volume pattern confirms the Cup & Handle formation with classic volume characteristics
• During cup formation, volume contracted during the decline and expanded during recovery
• Handle formation shows diminishing volume, indicating reduced selling pressure
• Recent breakout accompanied by significant volume spike (2.7M vs average), confirming institutional participation
• Volume-price correlation remains positive, supporting the bullish breakout thesis
Key Technical Levels:
Support Levels:
• Primary Support: 3,500
• Secondary Support: 3,400
• Major Support: 3,200
Resistance Levels:
• Immediate Resistance: 3,700 (Previous highs and psychological level)
• Major Resistance: 3,867 (52 Week high marked on chart)
• Extended Target: 4,200 (Cup & Handle measured move target)
Technical Patterns Identified:
• Cup & Handle Pattern: Primary bullish continuation pattern spanning 5 months
• Ascending Triangle: Within the handle formation, showing higher lows
• Volume Accumulation Pattern: Consistent with institutional buying during consolidation phases
Trade Setup:
Entry Strategy:
• Primary Entry: 3,650-3,680 (Current levels on any minor pullback)
• Secondary Entry: 3,580-3,620
• Aggressive Entry: Market price for momentum traders
Exit Levels:
• Target 1: 3,800 (Near-term resistance, book 30% profits)
• Target 2: 3,950 (Previous highs breach, book 40% profits)
• Target 3: 4,200 (Cup & Handle measured move, remaining 30%)
Risk Management:
• Stop Loss: 3,480 (Below handle low with 5% buffer)
• Risk-Reward Ratio: 1:3 (Risk of 170 points vs reward of 500+ points to first major target)
• Maximum Risk per Trade: 2% of portfolio capital
Position Sizing:
• Conservative Approach: 1-1.5% of portfolio given the strong setup
• Moderate Approach: 2-2.5% for traders comfortable with mid-cap volatility
• Scale-in Strategy: 50% on initial entry, 30% on any dip to secondary entry, 20% on momentum confirmation
Sectoral and Fundamental Backdrop:
Sector Analysis:
• Consumer Discretionary sector showing resilience amid economic recovery
• Jewellery and watches segment benefiting from the wedding season demand and festival purchases
• Luxury consumption trends supporting the premium positioning of Titan's brands
• Rural demand recovery provides an additional growth catalyst for the company
Fundamental Highlights:
• Strong brand portfolio including Tanishq, Titan, Fastrack, and Sonata
• Consistent market share gains in the organised jewellery retail segment
• Digital transformation initiatives are improving operational efficiency
• Expansion in tier-2 and tier-3 cities driving geographical diversification
Macroeconomic Factors:
• Favourable gold price trends supporting jewellery business margins
• Rising disposable income in Indian households is boosting luxury spending
• The government's focus on organized retail supporting compliant players like Titan
• Wedding season and festival demand provide seasonal tailwinds
Key Risks to Monitor:
• Gold price volatility is impacting raw material costs and consumer demand
• Competition from online jewellery platforms and regional players
• Economic slowdown potentially affecting discretionary spending
• Regulatory changes in gold import duties or GST rates
My Take:
This technical setup presents a compelling risk-reward opportunity with the Cup & Handle pattern completion, strong volume confirmation, and favourable sectoral backdrop supporting the bullish thesis for Titan Company.
Keep in the Watchlist.
NO RECO. For Buy/Sell.
📌Thank you for exploring my idea! I hope you found it valuable.
🙏FOLLOW for more
👍BOOST if you found it useful.
✍️COMMENT below with your views.
Meanwhile, check out my other stock ideas on the right side until this trade is activated. I would love your feedback.
Disclaimer: "I am not a SEBI REGISTERED RESEARCH ANALYST AND INVESTMENT ADVISER."
This analysis is intended solely for informational and educational purposes and should not be interpreted as financial advice. It is advisable to consult a qualified financial advisor or conduct thorough research before making investment decisions.
相關出版品
免責聲明
這些資訊和出版物並非旨在提供,也不構成TradingView提供或認可的任何形式的財務、投資、交易或其他類型的建議或推薦。請閱讀使用條款以了解更多資訊。