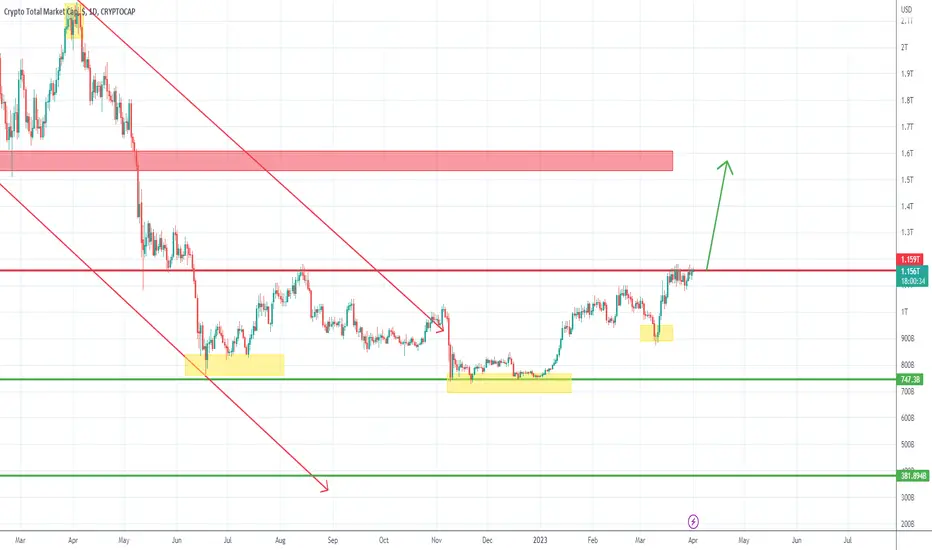
After a 2-month consolidation of around 750 in November and December last year, Total started to rise at the beginning of the year and in mid-February passed above the 1T important zone.
A correction followed, but the bulls took control again once it dropped again under 1T, putting in a higher low on our chart.
For 3 weeks now the price is consolidating just under important horizontal resistance and is looking like bulls are waiting for a trigger to break.
In the case of a break, this would be of great importance, confirming a very large inverted H&S pattern, started in June 2022.
The measured target for the pattern is around 1.5T, a zone that is very nicely aligned with another important horizontal level.
As long as the price is above the 1.05-1.1 zone I'm bullish
📈 Forex & XAU/USD Channel:
t.me/intradaytradingsignals
💎 Crypto Channel:
t.me/FanCryptocurrency
相關出版品
免責聲明
這些資訊和出版物並非旨在提供,也不構成TradingView提供或認可的任何形式的財務、投資、交易或其他類型的建議或推薦。請閱讀使用條款以了解更多資訊。
📈 Forex & XAU/USD Channel:
t.me/intradaytradingsignals
💎 Crypto Channel:
t.me/FanCryptocurrency
相關出版品
免責聲明
這些資訊和出版物並非旨在提供,也不構成TradingView提供或認可的任何形式的財務、投資、交易或其他類型的建議或推薦。請閱讀使用條款以了解更多資訊。
