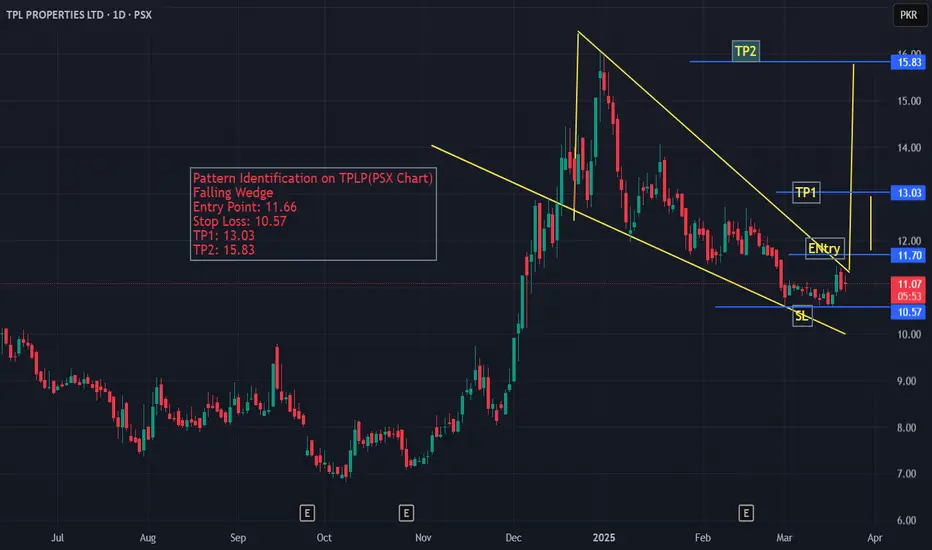
The Chart of TPLP shows a pattern of Falling Wedge, The projections for this stock and the entry point, stop loss and TP1 and TP2 are mentioned on the chart for traders and ivestors.
免責聲明
這些資訊和出版物並不意味著也不構成TradingView提供或認可的金融、投資、交易或其他類型的意見或建議。請在使用條款閱讀更多資訊。
免責聲明
這些資訊和出版物並不意味著也不構成TradingView提供或認可的金融、投資、交易或其他類型的意見或建議。請在使用條款閱讀更多資訊。