TRUMPUSDT Bear Flag Breakdown or Fakeout? Key Levels to Watch!
📊 TRUMPUSDT 1H Analysis – Bear Flag in Play! 📊
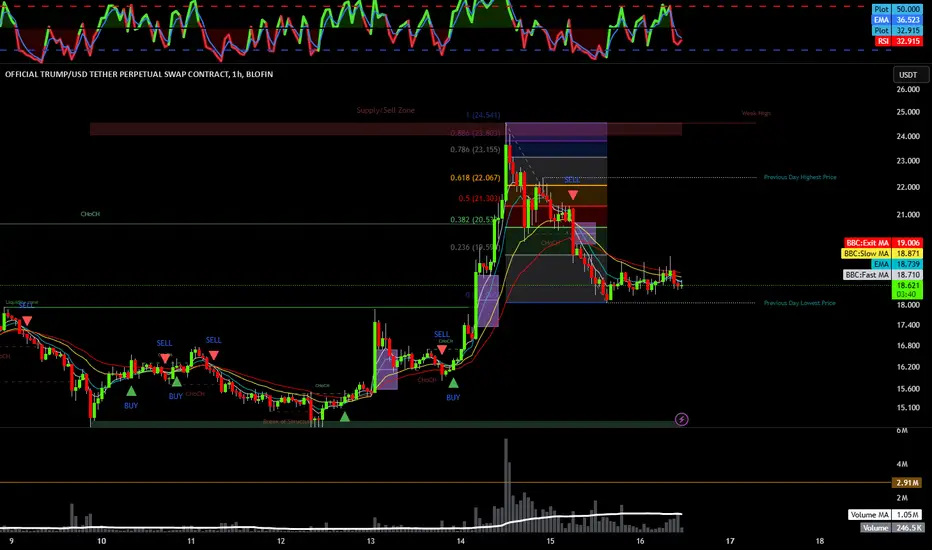
🔻 Current Structure:
Bear flag formation after rejection from $22.06 (Fib 0.618).
EMA 5, 9, 21, 34 are bearishly aligned, confirming downtrend momentum.
Supply Zone: $24.07 - $24.55 (Major Resistance).
Demand Zone: $14.45 - $14.80 (Last support before deeper sell-off).
📉 Bearish Scenario:
Break below $18.50 = Continuation to $17.50 - $16.00.
Failure to reclaim EMA 21 ($18.86) signals further weakness.
📈 Bullish Invalidation:
Break above $19.50 = Short-term bullish momentum shift.
Above $20.50 (Fib 0.382) → Target $22.00+ if demand steps in.
📍 Key Levels to Watch:
🔸 Bearish Continuation: Below $18.50.
🔸 Bullish Reversal: Above $19.50.
⚡ Is this a bear trap or legit breakdown? Let’s see how price reacts! ⚡
交易進行
Price is stuck below EMAs (5, 9, 21, 34) after breaking structure. Signs of distribution as sellers step in. 🎯 Bias:Bearish to neutral unless price reclaims 18.75 - 19.00 with strength.
Below 18.30, expect continuation lower.
交易結束:目標達成
💡 Liquidity sweep at 16.530 - 15.471 could be a potential Sniper-Level Long entry.免責聲明
這些資訊和出版物並不意味著也不構成TradingView提供或認可的金融、投資、交易或其他類型的意見或建議。請在使用條款閱讀更多資訊。
免責聲明
這些資訊和出版物並不意味著也不構成TradingView提供或認可的金融、投資、交易或其他類型的意見或建議。請在使用條款閱讀更多資訊。