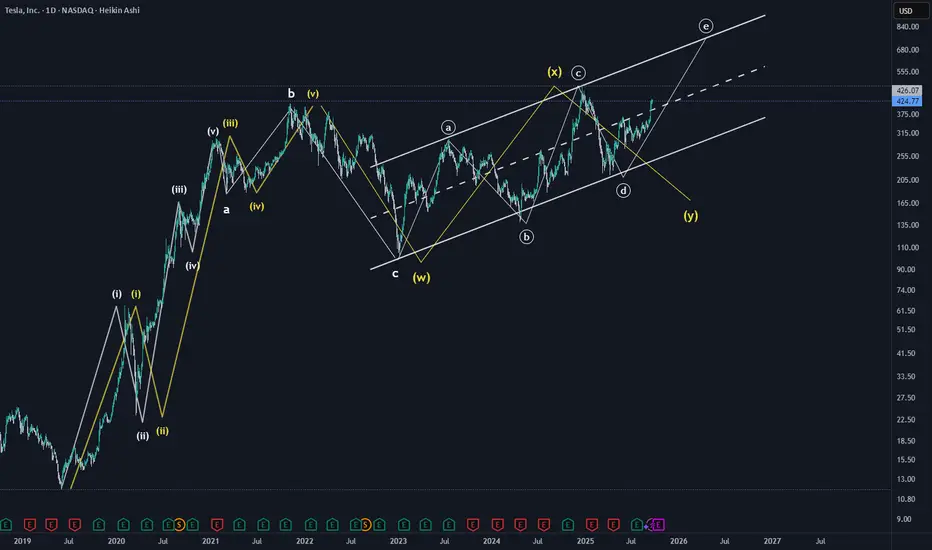
This chart provides a bullish and bearish wave pattern for Tesla. Even though the recent move was very impulsive, both bullish and bearish scenarios are equally possible. This is because the impulsive move seems to be wave C of either X wave or ending diagonal (E of ABCDE).
White represents Bullish scenario and Yellow represents bearish scenario.
Minimum Target reached for the C wave.

Note
**Disclaimer** : All details shared here is for educational purpose only. Please do your own research and consider appropriate risk management before making short term or long-term investment decisions.
Approach Market always with probabilities and make sure risk management in place.
Request your support by like, comment and follow
White represents Bullish scenario and Yellow represents bearish scenario.
Minimum Target reached for the C wave.
Note
**Disclaimer** : All details shared here is for educational purpose only. Please do your own research and consider appropriate risk management before making short term or long-term investment decisions.
Approach Market always with probabilities and make sure risk management in place.
Request your support by like, comment and follow
註釋
Correction is expected for Bullish scenario as well for the completion of wave A for the ABC within Wave E.免責聲明
這些資訊和出版物並不意味著也不構成TradingView提供或認可的金融、投資、交易或其他類型的意見或建議。請在使用條款閱讀更多資訊。