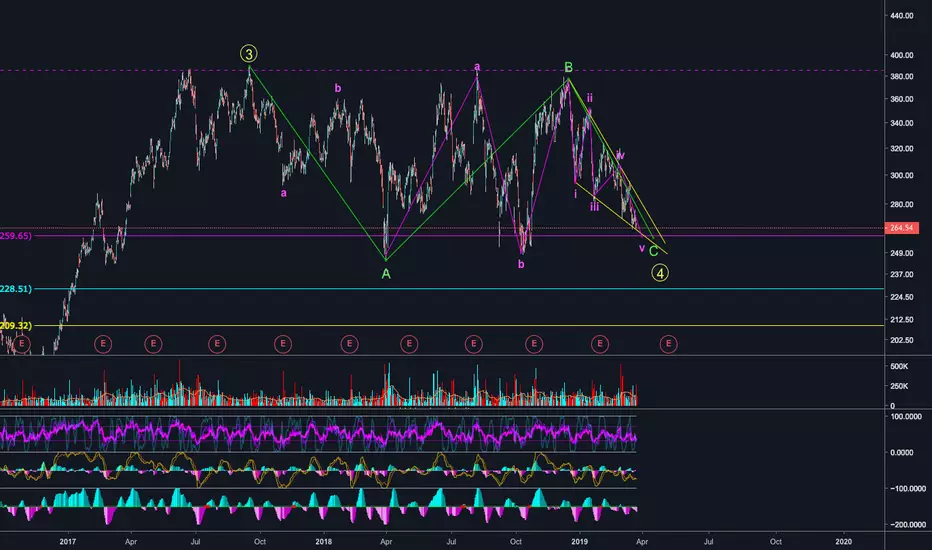
It's unclear if the wave structure is complete, but right now it looks like we have an ABC flat on both charts.
Interestingly, TSLA looks like it's in a Wave 4 (meaning up afterwards) while NIO is below its initial IPO price. So the question is, do both stocks trend together? So far the similar wave pattern would suggest it.
Interestingly, TSLA looks like it's in a Wave 4 (meaning up afterwards) while NIO is below its initial IPO price. So the question is, do both stocks trend together? So far the similar wave pattern would suggest it.
註釋
NIO chart:免責聲明
這些資訊和出版物並不意味著也不構成TradingView提供或認可的金融、投資、交易或其他類型的意見或建議。請在使用條款閱讀更多資訊。