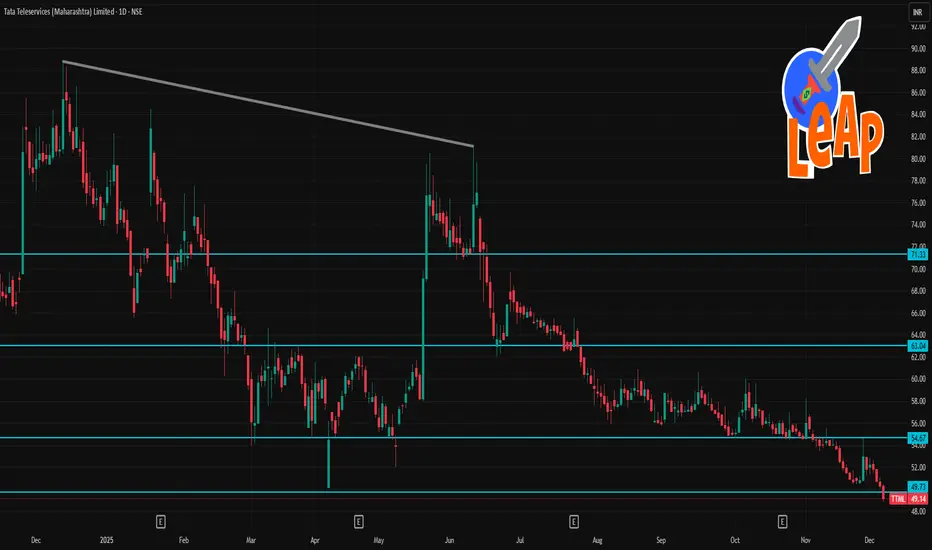
📈 Key data (as of 5 Dec 2025)
TTML closed around ₹ 49.14 – ₹ 49.16.
Day’s trading range: ≈ ₹48.83 – ₹50.46.
52-week range: ~ ₹48.83 (low) to ~ ₹88.90 (high).
🔎 Technical/Indicator Status (Short-Term)
According to a technical-analysis site: Most standard moving averages (5-day, 10-day, 20-day, 50-day, 100-day, 200-day) are signaling “Sell” on the 1-day chart.
Momentum indicators: 14-day RSI is ~ 27.6 (suggesting oversold).
Other indicators (MACD, Stochastic, CCI, etc.) also lean toward “Sell / Oversold.”
✅ What this suggests (for 1-day / very short-term traders)
TTML appears to be in a short-term downtrend or weak momentum: price below most moving averages, negative technical signals.
However, the oversold RSI might hint at a potential bounce or consolidation — some recovery might happen if market sentiment or broader triggers change.
Given recent 52-week low around current price levels, some traders may view current price zone as “bottom-ish.”
相關出版品
免責聲明
這些資訊和出版物並非旨在提供,也不構成TradingView提供或認可的任何形式的財務、投資、交易或其他類型的建議或推薦。請閱讀使用條款以了解更多資訊。