搜尋
產品
社群
市場
經紀商
更多
TW
立即開始
2021年3月1日
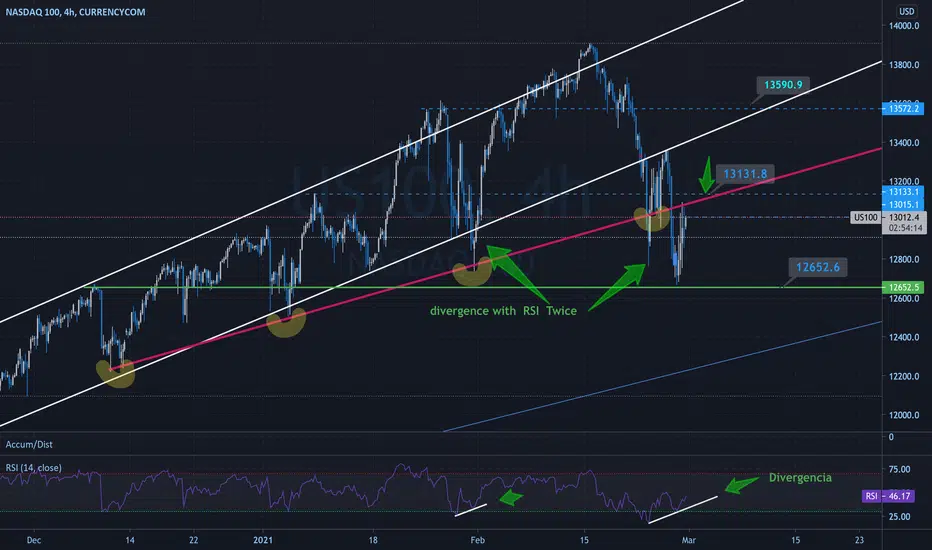
$NDX #nasdaq100 same Divergence with RSI from January
0
取得這個圖表
取得這個圖表
1
1
137
4h hours Chart is showing a divergence with the Relative Strength Index...
what do u think? bull or bear?
NDX
juanemilio212
關注
更多:
Chart Patterns
Divergence
Technical Indicators
nasdaq100
NASDAQ 100 CFD
NASDAQ 100 CFD
Trend Analysis
免責聲明
這些資訊和出版物並不意味著也不構成TradingView提供或認可的金融、投資、交易或其他類型的意見或建議。請在
使用條款
閱讀更多資訊。
Chart Patterns
Divergence
Technical Indicators
nasdaq100
NASDAQ 100 CFD
NASDAQ 100 CFD
Trend Analysis
juanemilio212
關注
更多:
免責聲明
這些資訊和出版物並不意味著也不構成TradingView提供或認可的金融、投資、交易或其他類型的意見或建議。請在
使用條款
閱讀更多資訊。