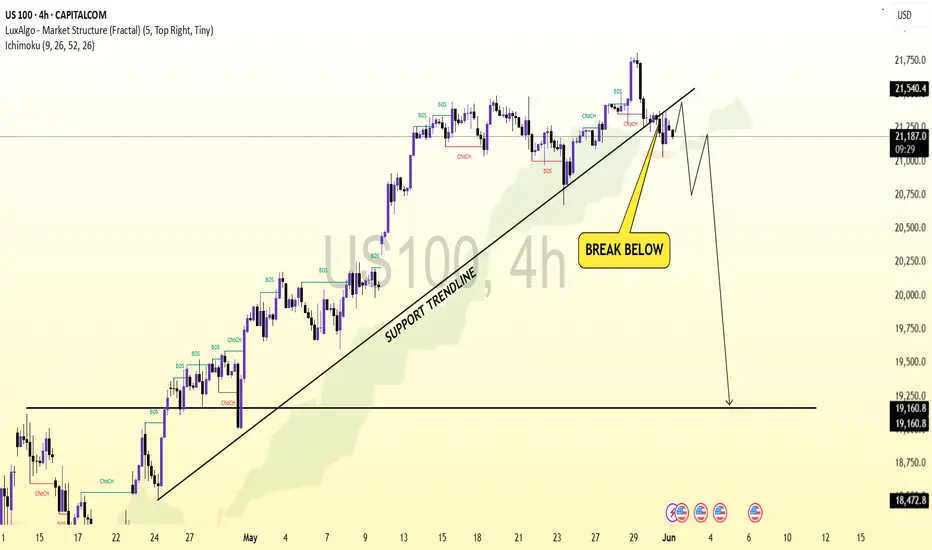
This 4-hour chart of the US100 (Nasdaq 100) shows a break below a long-standing ascending support trendline. The price has breached the trendline and is currently retesting the underside, suggesting a potential bearish reversal.
Key points:
The trendline break signals a possible end to the previous bullish momentum.
A retest of the broken support turned resistance is in progress.
If the price fails to reclaim the trendline, a deeper drop toward the 19,160 and 18,472 levels is likely.
The projected path indicates a short-term bounce followed by a significant bearish move.
Overall, the chart suggests bearish sentiment unless buyers reclaim and hold above the broken trendline.
免責聲明
這些資訊和出版物並不意味著也不構成TradingView提供或認可的金融、投資、交易或其他類型的意見或建議。請在使用條款閱讀更多資訊。
免責聲明
這些資訊和出版物並不意味著也不構成TradingView提供或認可的金融、投資、交易或其他類型的意見或建議。請在使用條款閱讀更多資訊。