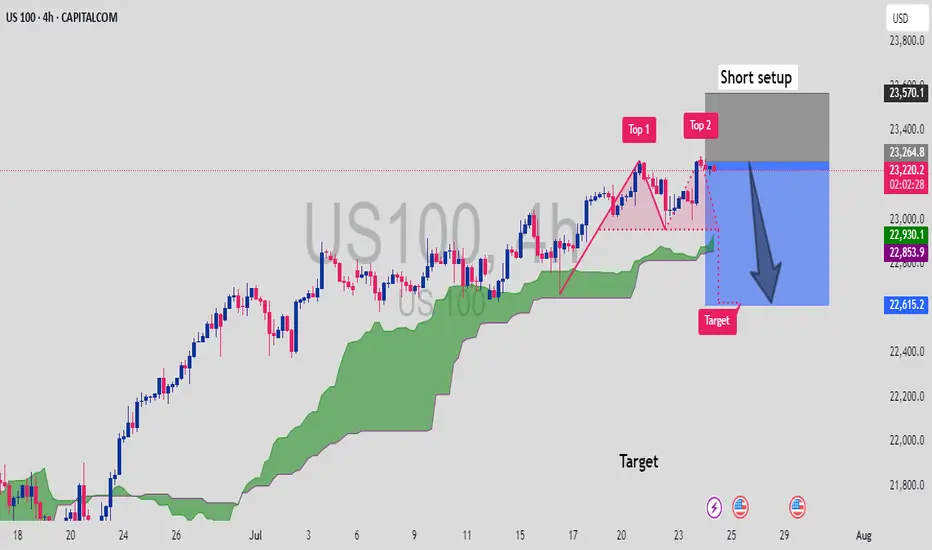
The US100 (Nasdaq) is showing a potential double top pattern on the 4H chart, indicating a bearish reversal may be underway. The price has tested resistance near 23,570 twice, failing to break higher (Top 1 & Top 2), forming a classic double top structure.
Technically:
Bearish divergence at highs
Price is rejecting resistance with confirmation candles
A break below neckline support around 22,930 could trigger downward momentum
Fundamentally:
Market sentiment is cautious due to mixed earnings reports and uncertainty around Fed policy
Rising yields and hawkish Fed expectations may weigh on tech-heavy indices
📌 Short Setup
Entry: Below 23,200
Target: 22,615 (measured move)
Stop: Above 23,570
🔻 Watching for bearish confirmation before full entry. Trade with risk management.
Note: If you found this helpful, like and follow for more trade ideas!
Share My Idea With Your Firends Mention Your Feed back Comment Section
This is not financial advice. Please conduct your own research and manage risk accordingly.
免責聲明
這些資訊和出版物並不意味著也不構成TradingView提供或認可的金融、投資、交易或其他類型的意見或建議。請在使用條款閱讀更多資訊。
免責聲明
這些資訊和出版物並不意味著也不構成TradingView提供或認可的金融、投資、交易或其他類型的意見或建議。請在使用條款閱讀更多資訊。