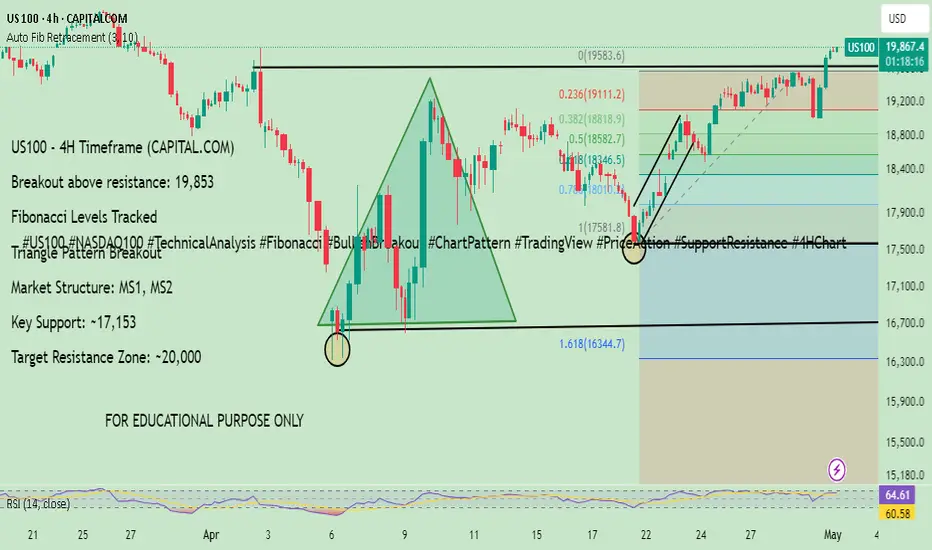
This chart analyzes the US100 (NASDAQ 100) on the 4H timeframe using Capital.com data feed. A bullish continuation pattern is identified, highlighted by a triangle consolidation breakout and Fibonacci retracement levels. Key zones, including the 0.236 and 0.618 retracement levels, are used to map potential price movement. Price action shows a breakout above a resistance zone near 19,853, which could signal further upward momentum. Trend structure, support/resistance levels, and market structure points (MS1 and MS2) are clearly labeled for clarity.
FOR EDUCATIONAL PURPOSE ONLY.
#US100 #NASDAQ100 #TechnicalAnalysis #Fibonacci #BullishBreakout #ChartPattern #TradingView #PriceAction #SupportResistance #4HChart
FOR EDUCATIONAL PURPOSE ONLY.
#US100 #NASDAQ100 #TechnicalAnalysis #Fibonacci #BullishBreakout #ChartPattern #TradingView #PriceAction #SupportResistance #4HChart
交易進行
Watching for continuation of bullish momentum after breakout above 19,853. A retest of this level followed by a bullish confirmation candle could offer a good long entry opportunity. Keep an eye on overall tech sector sentiment and US economic news that may impact NASDAQ.FOR EDUCATIONAL PURPOSE ONLY.
Manage risk properly.
#US100 #NASDAQ100 #TechnicalAnalysis #Fibonacci #BullishBreakout #ChartPattern #TradingView #PriceAction #SupportResistance #4HChart
註釋
US100 has just broken above a major resistance zone (~19,853) with strong bullish momentum. The breakout follows a textbook bullish continuation pattern supported by Fibonacci confluence and previous market structure zones (MS1 and MS2). As long as price holds above this breakout zone, I expect continuation toward the psychological level of 20,000. Will be watching for a retest and bullish confirmation to scale in further.#US100 #NASDAQ100 #BullishBreakout #TechnicalAnalysis #FibonacciLevels
#PriceAction #SupportResistance #MarketStructure #ContinuationPattern #TradingStrategy
交易結束:目標達成
US100 – Target Hit at 19,853!Price broke through resistance with strong momentum, validating the bullish continuation pattern. Trade completed successfully with a clean technical setup and solid follow-through.
The US100 (NASDAQ 100) followed through on the bullish continuation setup, breaking out from a consolidation triangle and clearing the major resistance zone around 19,853. The move was backed by strong structure, Fibonacci levels, and bullish price action confirmation. The trade idea reached its projected target with high precision, showcasing the importance of patience and confluence.
Hit Signals (Short Breakdown):
Triangle Breakout: Confirmed bullish continuation
Resistance Break: 19,853 key level taken out with strong close
Fibonacci Confluence: Alignment with retracement and extension levels
Bullish Momentum: Clear volume surge on breakout (if applicable)
Higher High/Higher Low structure intact.
FOR EDUCATIONAL PURPOSE ONLY.
#US100 #NASDAQ100 #TargetHit #Breakout #TradingSuccess
#Fibonacci #PriceAction #TechnicalSetup #BullishMomentum #ChartPattern
相關出版品
免責聲明
這些資訊和出版物並不意味著也不構成TradingView提供或認可的金融、投資、交易或其他類型的意見或建議。請在使用條款閱讀更多資訊。
