看空
US30 showing a short signal to 30,489
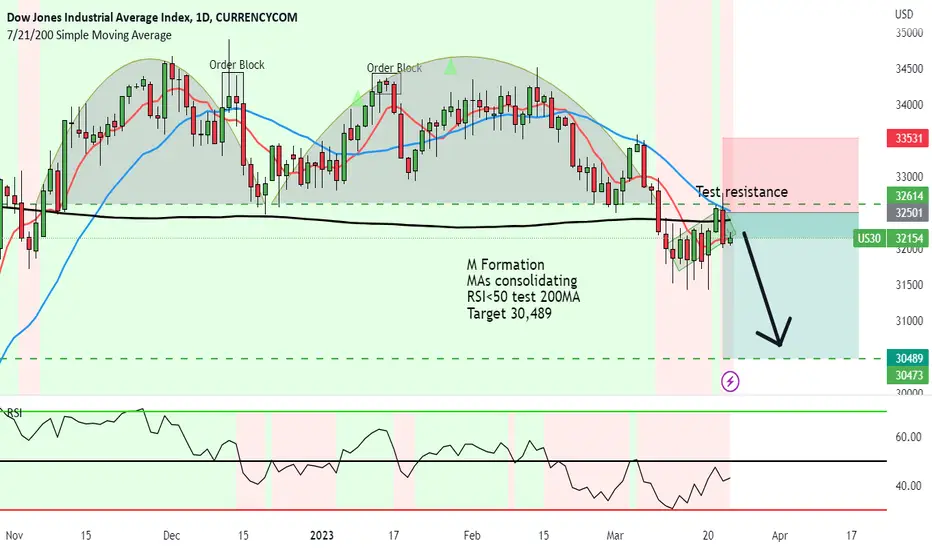
M Formation formed on US 30 followed by a break in the neckline and then a rising flag formation which broke below.
MAs consolidating
RSI<50 test 200MA
America is showing conflicting signals as the price is currently consolidating followed by the confusion with the banking crises.
I guess price action is showing downside to come.
Target 30,489
MAs consolidating
RSI<50 test 200MA
America is showing conflicting signals as the price is currently consolidating followed by the confusion with the banking crises.
I guess price action is showing downside to come.
Target 30,489
🌐NEW Website 2025:
mati-trader.lovable.app/
✅ Facebook:
facebook.com/groups/matitrader
𝕏 (Formerly Twitter):
twitter.com/timonr
Trade Well,
Timon Rossolimos
Founder, MATI Trader
(Pro trader since 2003)
mati-trader.lovable.app/
✅ Facebook:
facebook.com/groups/matitrader
𝕏 (Formerly Twitter):
twitter.com/timonr
Trade Well,
Timon Rossolimos
Founder, MATI Trader
(Pro trader since 2003)
免責聲明
這些資訊和出版物並非旨在提供,也不構成TradingView提供或認可的任何形式的財務、投資、交易或其他類型的建議或推薦。請閱讀使用條款以了解更多資訊。