DOW JONES entering a transition Channel as in late 2020.
This is not the first time I bring forward the ideal of Dow Jones following this 2020 fractal:

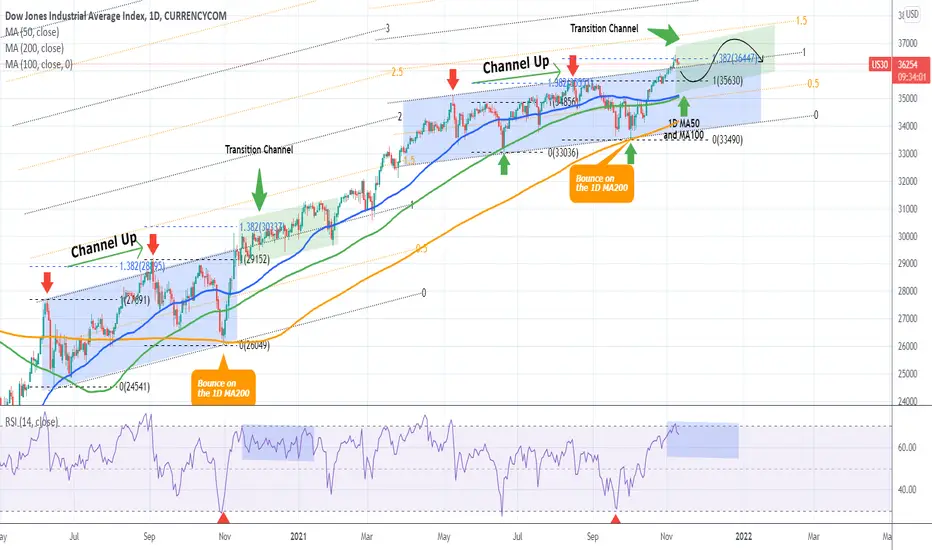
As you see from my October 01 idea above, this fractal comparison accurately projected the bottom of the Channel Up (blue) and the subsequent rally that followed. This time I am expanding this idea on the Fibonacci scale, as DJI broke above the Channel Up and hit the 1.382 Fibonacci extension from the bottom.
On November 09 2020, the price also broke above its Channel Up (blue), hit the 1.382 Fib extension and then entered a new (green) Channel Up, which I call transitional as it took the index from the first Channel Up (blue) towards the higher extension levels of the Fibonacci Channel in early 2021.
During that time the RSI (always on the 1D time-frame) turned sideways, indicating this Transition phase more clearly. I am expecting a similar process until the end of the year, meaning a pull-back towards the 1D MA50 (blue trend-line) is possible but as long as it supports, we are more likely to see prices above 37000 at the end of the year.
--------------------------------------------------------------------------------------------------------
Please like, subscribe and share your ideas and charts with the community!
--------------------------------------------------------------------------------------------------------
👑Best Signals (Forex/Crypto+70% accuracy) & Account Management (+20% profit/month on 10k accounts)
💰Free Channel t.me/tradingshotglobal
🤵Contact info@tradingshot.com t.me/tradingshot
🔥New service: next X100 crypto GEMS!
💰Free Channel t.me/tradingshotglobal
🤵Contact info@tradingshot.com t.me/tradingshot
🔥New service: next X100 crypto GEMS!
免責聲明
這些資訊和出版物並不意味著也不構成TradingView提供或認可的金融、投資、交易或其他類型的意見或建議。請在使用條款閱讀更多資訊。