Title:
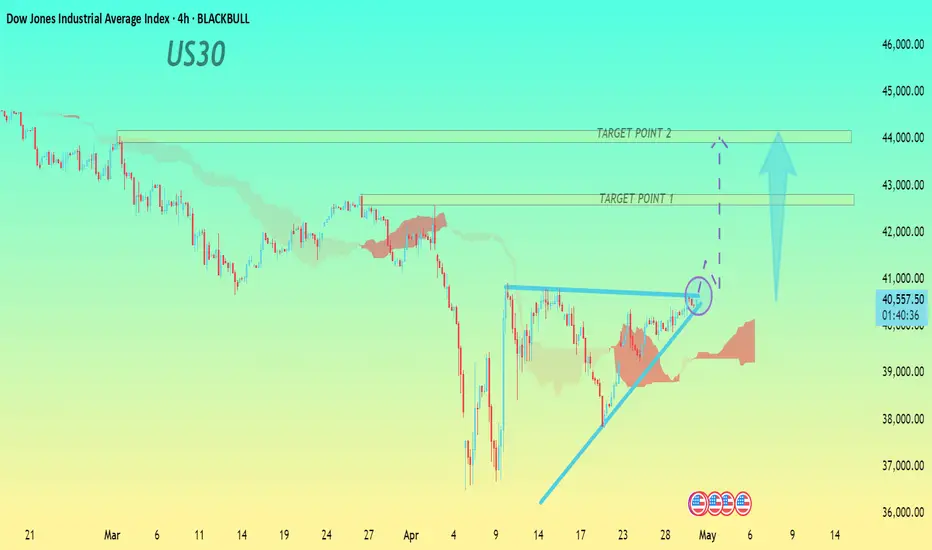
"US30 Bullish Breakout Setup – 4H Timeframe (Chart Pattern Analysis)"
Entry Point:
Consider entering a buy trade upon a confirmed breakout above the resistance trendline (around 40,800 – 41,000 zone), marked by the blue circle.
Target Point 1:
First target is around 42,500, which aligns with the first resistance zone and previous price structure.
Target Point 2:
Second (extended) target is near 44,000, where the next major resistance zone is marked.
Stop-Loss (SL):
Set SL below the breakout structure and ascending trendline, around 39,500 – 39,700, to manage risk if the breakout fails.
The chart illustrates a bullish ascending triangle pattern, suggesting accumulation before a breakout. The price is also supported by Ichimoku cloud structure showing a possible bullish shift. A breakout above resistance could trigger a strong move toward the outlined targets, offering a solid risk-reward opportunity.
交易進行
US30 running in profit 免責聲明
這些資訊和出版物並不意味著也不構成TradingView提供或認可的金融、投資、交易或其他類型的意見或建議。請在使用條款閱讀更多資訊。
免責聲明
這些資訊和出版物並不意味著也不構成TradingView提供或認可的金融、投資、交易或其他類型的意見或建議。請在使用條款閱讀更多資訊。