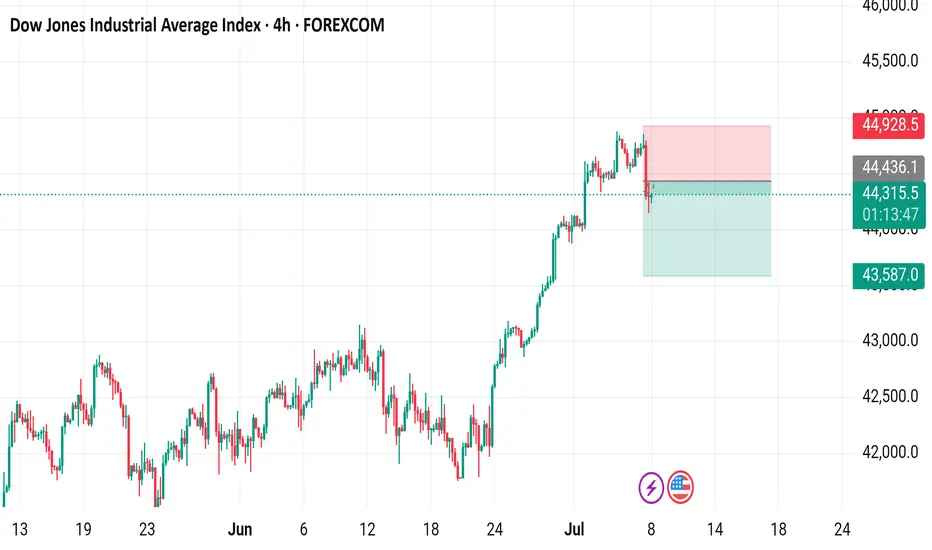
4-hour candlestick chart of the Dow Jones Industrial Average Index (US30) showing the price movement from late June to early July 2025. The current price is 44,314.0, with a slight increase of +23.0 (+0.05%). The chart includes buy and sell signals at 44,316.5 and 44,310.5 respectively, with highlighted resistance and support zones. The index has shown a general upward trend with some volatility over the period.
手動結束交易
Target achieved on $44,148 it's a very long directions so close full now don't hold guy's免責聲明
這些資訊和出版物並不意味著也不構成TradingView提供或認可的金融、投資、交易或其他類型的意見或建議。請在使用條款閱讀更多資訊。
免責聲明
這些資訊和出版物並不意味著也不構成TradingView提供或認可的金融、投資、交易或其他類型的意見或建議。請在使用條款閱讀更多資訊。