📊 USD/CHF Q3 Forecast
Model Type: Proprietary Distribution Cycle Model
Instrument: USD/CHF
Trading Venue: IG
Published: July 2025
🔍 Market Phases Identified
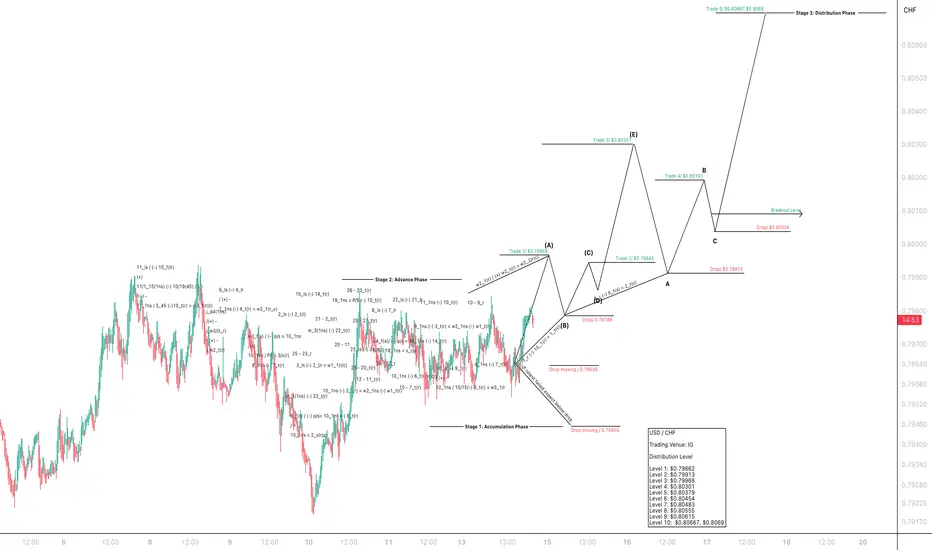
Stage 1: Accumulation Phase
Accumulation is complete, with structural support forming near:
$0.79454 (drop missed)
$0.79636 (drop missed)
Stage 2: Advance Phase
Breakout structure unfolding with five internal legs mapped as:
Trade 1: $0.79968 (Wave A)
Trade 2: $0.79945 (Wave D pullback)
Trade 3: $0.80301 (Wave E high)
Trade 4: $0.80119 (Re-entry into Wave B-C zone)
Stage 3: Distribution Phase (Projected)
Model forecasts breakout above $0.80038 targeting:
Distribution Level 5 and above (see distribution table below)
🧮 Forecasted Distribution Levels:
Level 1: $0.79862
Level 2: $0.79913
Level 3: $0.79968
Level 4: $0.80301
Level 5: $0.80379
Level 6: $0.80454
Level 7: $0.80483
Level 8: $0.80555
Level 9: $0.80615
Level 10: $0.80667, $0.8069
🧠 Structural Commentary:
The market is responding to each inflection point with high accuracy to the cycle model.
Drop levels ($0.79912, $0.80038) act as short-term liquidity checks during retracement phases.
Missed drops near $0.794–$0.796 remain potential tail risks if a distribution rejection occurs before L5.
✅ Execution Strategy Summary
4 trades forecasted with near-perfect cycle timing.
Breakout confirmation is anticipated above $0.80038 toward L5–L10.
Disclaimer: The following forecast is derived from a proprietary, hand-crafted mathematical model developed independently over several years. It does not rely on traditional indicators, technical patterns, or third-party frameworks such as Elliott Wave Theory.
This model calculates price action based on distribution phases, economic timing cycles, and natural market imbalances.
Model Type: Proprietary Distribution Cycle Model
Instrument: USD/CHF
Trading Venue: IG
Published: July 2025
🔍 Market Phases Identified
Stage 1: Accumulation Phase
Accumulation is complete, with structural support forming near:
$0.79454 (drop missed)
$0.79636 (drop missed)
Stage 2: Advance Phase
Breakout structure unfolding with five internal legs mapped as:
Trade 1: $0.79968 (Wave A)
Trade 2: $0.79945 (Wave D pullback)
Trade 3: $0.80301 (Wave E high)
Trade 4: $0.80119 (Re-entry into Wave B-C zone)
Stage 3: Distribution Phase (Projected)
Model forecasts breakout above $0.80038 targeting:
Distribution Level 5 and above (see distribution table below)
🧮 Forecasted Distribution Levels:
Level 1: $0.79862
Level 2: $0.79913
Level 3: $0.79968
Level 4: $0.80301
Level 5: $0.80379
Level 6: $0.80454
Level 7: $0.80483
Level 8: $0.80555
Level 9: $0.80615
Level 10: $0.80667, $0.8069
🧠 Structural Commentary:
The market is responding to each inflection point with high accuracy to the cycle model.
Drop levels ($0.79912, $0.80038) act as short-term liquidity checks during retracement phases.
Missed drops near $0.794–$0.796 remain potential tail risks if a distribution rejection occurs before L5.
✅ Execution Strategy Summary
4 trades forecasted with near-perfect cycle timing.
Breakout confirmation is anticipated above $0.80038 toward L5–L10.
Disclaimer: The following forecast is derived from a proprietary, hand-crafted mathematical model developed independently over several years. It does not rely on traditional indicators, technical patterns, or third-party frameworks such as Elliott Wave Theory.
This model calculates price action based on distribution phases, economic timing cycles, and natural market imbalances.
Institutional Note:
For institutional review, independent verification, or strategic collaboration:
institutions@bmoses.com.au
For institutional review, independent verification, or strategic collaboration:
institutions@bmoses.com.au
免責聲明
這些資訊和出版物並不意味著也不構成TradingView提供或認可的金融、投資、交易或其他類型的意見或建議。請在使用條款閱讀更多資訊。