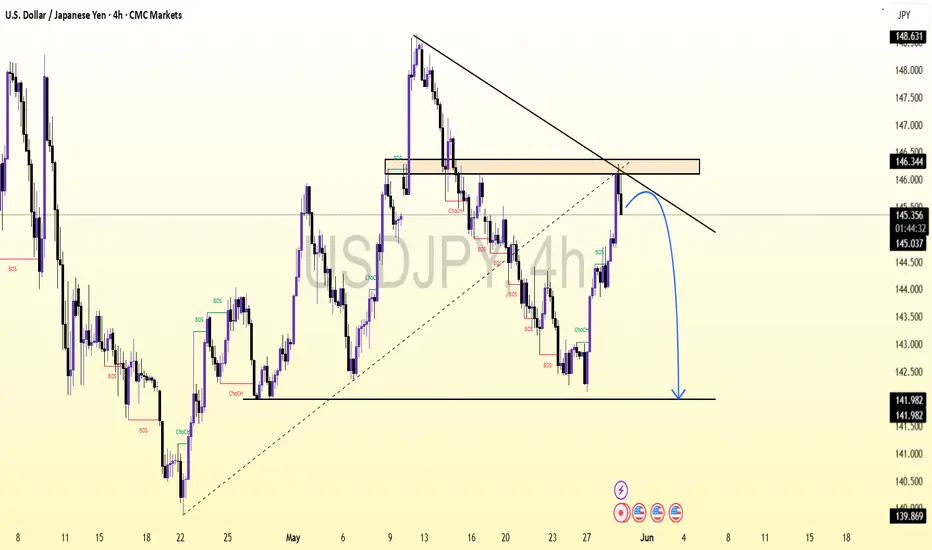
This USD/JPY 4H chart shows a bearish setup forming:
Key Resistance Zone around 146.3 has been respected multiple times.
Descending Trendline continues to cap price from above.
Price is currently testing this resistance zone again.
The chart suggests a possible rejection here, with a projected move down toward the 141.98 support level.
Bearish order blocks, Break of Structure (BoS), and **Change of Character (ChoCh) signals support a downside bias.
Overall, this analysis points to a potential short opportunity if price fails to break above the resistance and confirms reversal signs.
交易結束:達到停損點
Target almost hit JOIN MY TELEGRAM:
FREE SIGNALS TECHNICAL CHART AND EDUCATOIN
t.me/+j_sv6p9sL5I0MDY0
FREE SIGNALS TECHNICAL CHART AND EDUCATOIN
t.me/+j_sv6p9sL5I0MDY0
免責聲明
這些資訊和出版物並不意味著也不構成TradingView提供或認可的金融、投資、交易或其他類型的意見或建議。請在使用條款閱讀更多資訊。
JOIN MY TELEGRAM:
FREE SIGNALS TECHNICAL CHART AND EDUCATOIN
t.me/+j_sv6p9sL5I0MDY0
FREE SIGNALS TECHNICAL CHART AND EDUCATOIN
t.me/+j_sv6p9sL5I0MDY0
免責聲明
這些資訊和出版物並不意味著也不構成TradingView提供或認可的金融、投資、交易或其他類型的意見或建議。請在使用條款閱讀更多資訊。