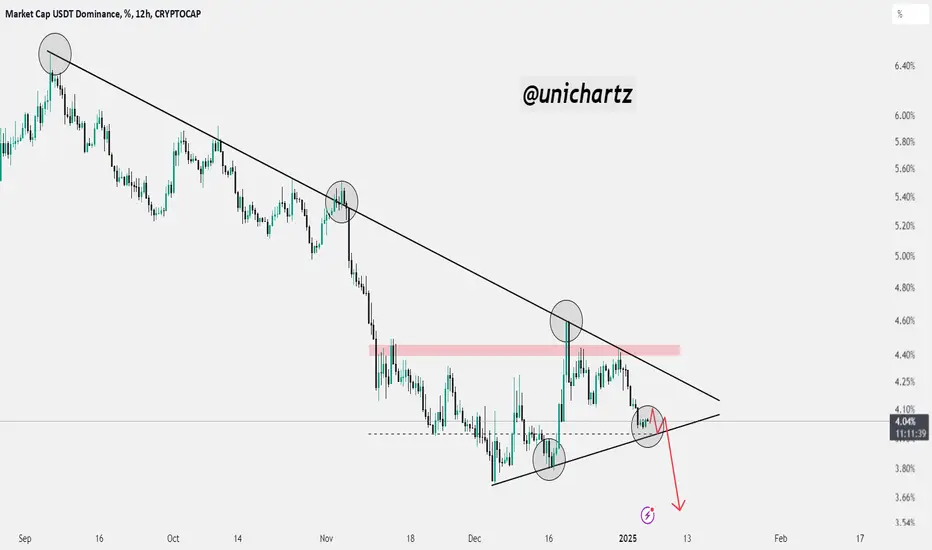
The chart shows a clear descending triangle pattern in the USDT dominance (USDT.D), with the dominance steadily declining and forming lower highs along a downward trendline.
This indicates weakening demand for stablecoins, which often correlates with increased risk appetite in the market as investors shift their funds from stablecoins to altcoins.
This indicates weakening demand for stablecoins, which often correlates with increased risk appetite in the market as investors shift their funds from stablecoins to altcoins.
免責聲明
這些資訊和出版物並不意味著也不構成TradingView提供或認可的金融、投資、交易或其他類型的意見或建議。請在使用條款閱讀更多資訊。