Technical View – Usha Martin Ltd (Daily Chart)
Trend Identification:
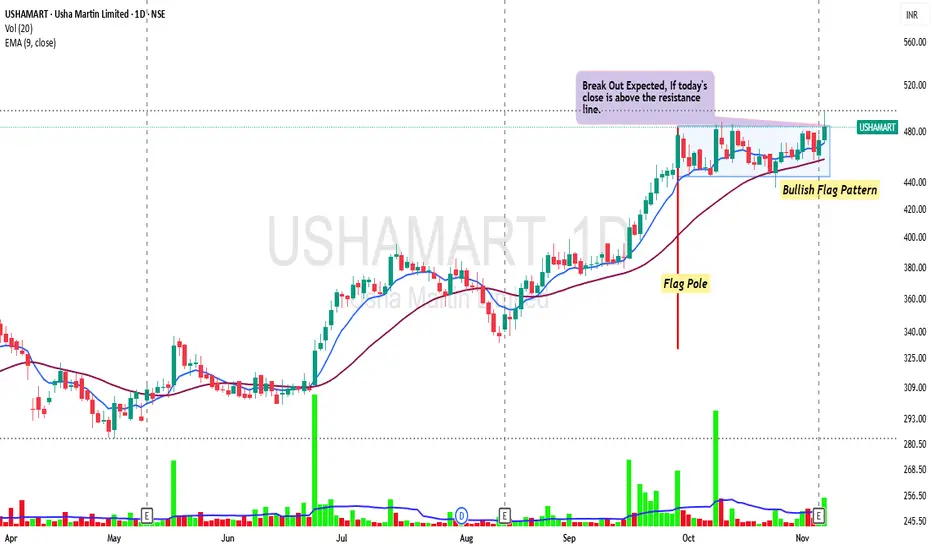
• The stock has been in a strong uptrend since July 2025, moving from around ₹330 to ₹490.
• Prices are consistently trading above the 9-day and 21-day EMAs, confirming bullish momentum.
Pattern Observation:
• After a sharp rally, the stock has entered a sideways consolidation phase between ₹450 and ₹490.
• This resembles a Flag Pattern, which usually forms as a pause in an existing uptrend before continuation.
Volume Analysis:
• Volume decreased during the consolidation phase, which is typical in a flag formation.
• A spike in volume near the upper boundary could confirm a breakout.
Indicator Analysis (EMA & RSI):
• EMA (9) is trending upward, showing continued buying interest.
• RSI is hovering around 60, indicating strength but not overbought.
Breakout Confirmation:
• A close above ₹495–₹500 with volume would confirm a bullish breakout from the flag pattern.
• Post-breakout targets could be around ₹580 (first target) and ₹650 (second target).
Support Zone:
• Immediate support lies near ₹455–₹460, where the lower boundary of the flag pattern is formed.
Disclaimer:
This analysis is for educational purposes only and not a buy/sell recommendation. Please do your own research or consult a financial advisor before investing.
Trend Identification:
• The stock has been in a strong uptrend since July 2025, moving from around ₹330 to ₹490.
• Prices are consistently trading above the 9-day and 21-day EMAs, confirming bullish momentum.
Pattern Observation:
• After a sharp rally, the stock has entered a sideways consolidation phase between ₹450 and ₹490.
• This resembles a Flag Pattern, which usually forms as a pause in an existing uptrend before continuation.
Volume Analysis:
• Volume decreased during the consolidation phase, which is typical in a flag formation.
• A spike in volume near the upper boundary could confirm a breakout.
Indicator Analysis (EMA & RSI):
• EMA (9) is trending upward, showing continued buying interest.
• RSI is hovering around 60, indicating strength but not overbought.
Breakout Confirmation:
• A close above ₹495–₹500 with volume would confirm a bullish breakout from the flag pattern.
• Post-breakout targets could be around ₹580 (first target) and ₹650 (second target).
Support Zone:
• Immediate support lies near ₹455–₹460, where the lower boundary of the flag pattern is formed.
Disclaimer:
This analysis is for educational purposes only and not a buy/sell recommendation. Please do your own research or consult a financial advisor before investing.
免責聲明
這些資訊和出版物並不意味著也不構成TradingView提供或認可的金融、投資、交易或其他類型的意見或建議。請在使用條款閱讀更多資訊。
免責聲明
這些資訊和出版物並不意味著也不構成TradingView提供或認可的金融、投資、交易或其他類型的意見或建議。請在使用條款閱讀更多資訊。