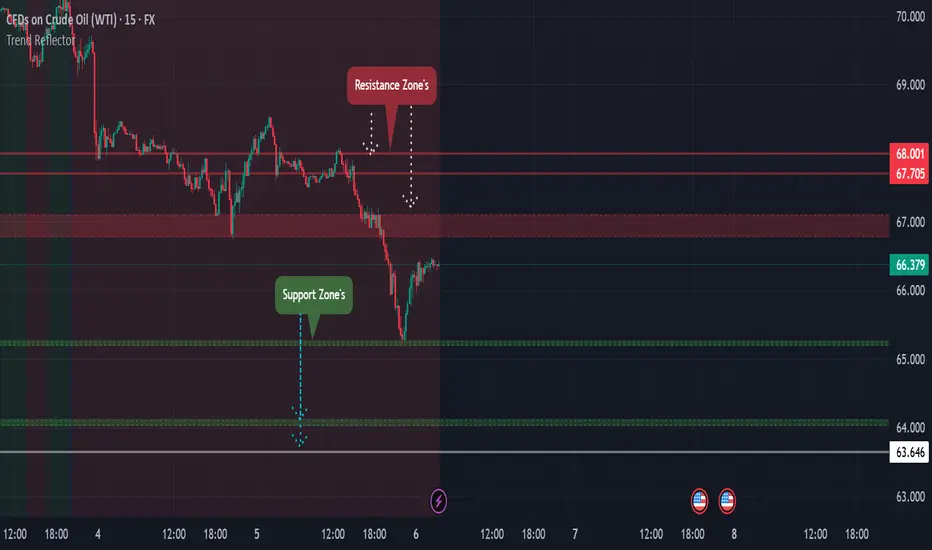
In the last session USOIL closed at 66.379 (2.4%) down and made of low of 65.208 , i've looked the chart on every TF and i've figured out some important levels of the crude ,on looking at the closing and price action formed our Near and major resistance zone is 66.795 - 67.090 this is a big zone but major zone and after that we've got the next resistance at 67.705 and the next one is 68.000 -68.105 , while looking at the chart in higher TF now market is going to compress or outburst for alternative scenario we've got some support zone's 65.259 - 65.200 is the level of support zone and it's also almost the low level of last session after that next support we've got on looking at every TF is 64.040 - 64.140 and after that 63.646 is the level which hold's some support , these are the level's which i got while studying the chart until new one is formed so we've to very clear here watch out every zone and level and look how price react's to it i've already told you how to trade in rejection and continuation pattern in our previous idea's ( and yeah sorry for typing mistake of level's and zone's in last USOIL idea published ) and i request every follower to avoid trading in news time ,now let's see how market react's on these levels.
交易進行
price rejected from the resistance zone placed short position SL is above Resistance zone hold it to low of yesterday session.註釋
price again moved to Resistance zone missed SL from just 21 pip now closed half quantity at 65.600 and i'll hold half quantity till 65.300.交易結束:達到停損點
price reached at SL aof above Resistance zone, so half qauntiy which i'm holding got the SL.Contact me on - t.me/at_Falcon
免責聲明
這些資訊和出版物並非旨在提供,也不構成TradingView提供或認可的任何形式的財務、投資、交易或其他類型的建議或推薦。請閱讀使用條款以了解更多資訊。
Contact me on - t.me/at_Falcon
免責聲明
這些資訊和出版物並非旨在提供,也不構成TradingView提供或認可的任何形式的財務、投資、交易或其他類型的建議或推薦。請閱讀使用條款以了解更多資訊。