I saw this developing this morning and bought about 400-500$ worth of Spy Puts I think this could play out and we see a big drop in Indexes by latest Wednesday
 https://lens.usercontent.google.com/image?vsrid=COqPlebCwJCxxgEQAhgBIiRiOWQ1YmFiNy00MjA3LTQ0ZTYtOGY1MS02MzVmMjRlNWIyYzMyBiICZHooCjjRpan6qYOPAw&gsessionid=PApssKeA8KfkE8mO1HZUAa2YL4udnuxcv3kEPYvbQpvin6pcnvAVXQ
註釋
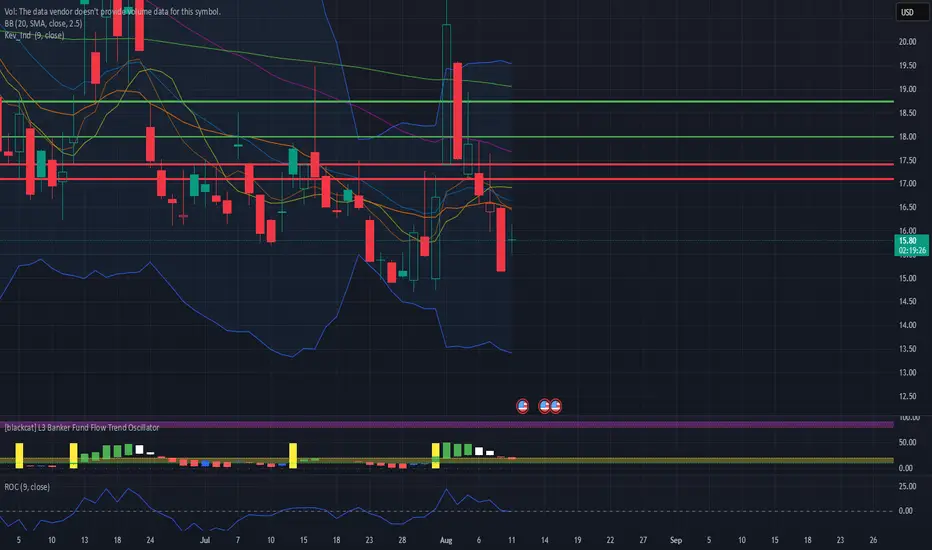
The Google Image is a Bullish Harami Pattern免責聲明
這些資訊和出版物並不意味著也不構成TradingView提供或認可的金融、投資、交易或其他類型的意見或建議。請在使用條款閱讀更多資訊。