As of April 29, 2025, here are the key 4-hour support and resistance levels for Wipro Ltd (NSE: WIPRO) based on recent technical analyses:
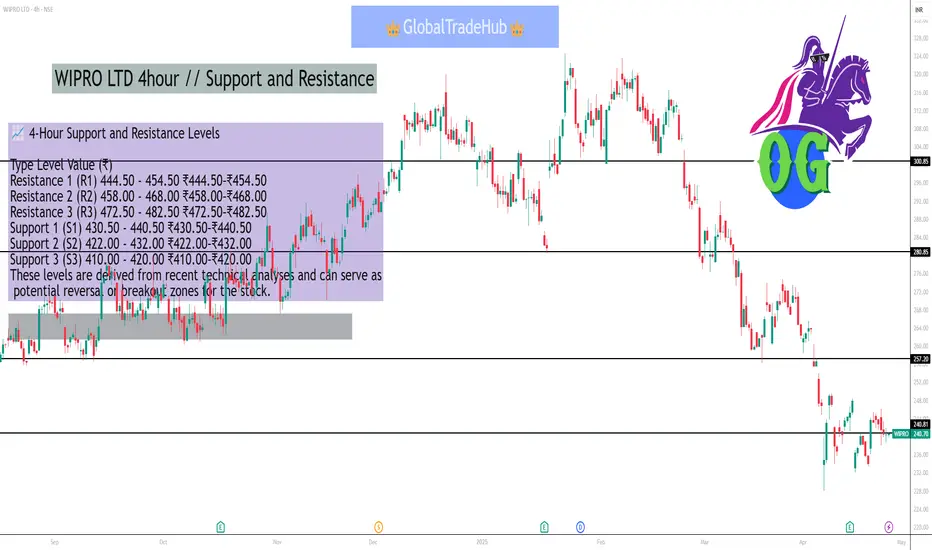
📈 4-Hour Support and Resistance Levels
Type Level Value (₹)
Resistance 1 (R1) 444.50 - 454.50 ₹444.50–₹454.50
Resistance 2 (R2) 458.00 - 468.00 ₹458.00–₹468.00
Resistance 3 (R3) 472.50 - 482.50 ₹472.50–₹482.50
Support 1 (S1) 430.50 - 440.50 ₹430.50–₹440.50
Support 2 (S2) 422.00 - 432.00 ₹422.00–₹432.00
Support 3 (S3) 410.00 - 420.00 ₹410.00–₹420.00
These levels are derived from recent technical analyses and can serve as potential reversal or breakout zones for the stock.
📊 Additional Technical Indicators
Relative Strength Index (RSI): Approximately 60, indicating a neutral to slightly bullish momentum.
Moving Average Convergence Divergence (MACD): Currently in a bearish crossover, suggesting potential downward pressure.
Bollinger Bands: The stock is trading above the upper band, indicating high volatility and potential overbought conditions.
📌 Key Observations
Resistance Levels: If Wipro breaks above ₹444.50, it may face resistance at ₹458.00 and ₹472.50.
Support Levels: A decline below ₹430.50 could lead to further support at ₹422.00 and ₹410.00.
Trend Analysis: The stock is currently testing the upper resistance zone. A breakout above ₹444.50 could signal a continuation of the upward trend. Conversely, a drop below ₹430.50 may indicate a bearish reversal.
Please note that these levels are based on historical data and technical analysis, and actual market conditions may vary. It's advisable to conduct further research or consult with a financial advisor before making investment decisions.
相關出版品
免責聲明
這些資訊和出版物並不意味著也不構成TradingView提供或認可的金融、投資、交易或其他類型的意見或建議。請在使用條款閱讀更多資訊。