Analysis:
Looking at the daily chart for Crude Oil, we appear to be seeing a very compelling confluence of bullish technical signals that suggest a potential significant reversal to the upside.
Textbook Falling Wedge Formation:
Price action is clearly consolidating within a well-defined falling wedge pattern.
We have observed multiple clear touches (3+ on the upper, 4+ on the lower trendline), indicating these boundaries are highly respected by the market.
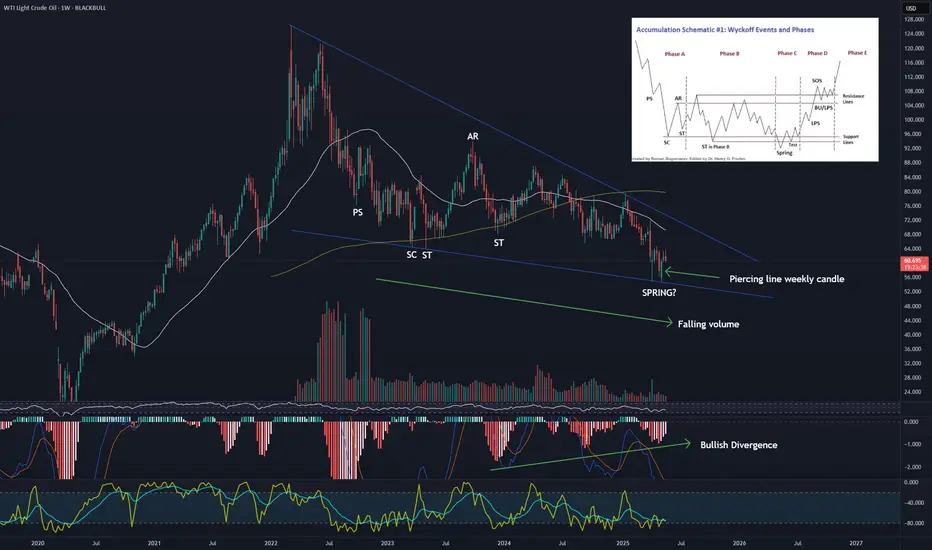
Crucially, volume has been declining as price consolidates within the wedge, a classic characteristic signifying diminishing selling pressure.
The angles of convergence also appear ideal, with the upper trendline being steeper than the lower.
Wyckoff Accumulation Schematic #1 in Play?
Diving deeper, the internal structure of this falling wedge strongly resembles Wyckoff's Accumulation Schematic #1.
We can identify potential phases:
PS (Preliminary Support): Early signs of buying.
SC (Selling Climax): A sharp sell-off often with high volume, marking potential capitulation.
AR (Automatic Rally): The first significant bounce after the SC.
ST (Secondary Test): Retesting the lows of the SC.
Spring: A key event where price dips below the established trading range support (or the wedge's lower trendline) only to quickly reverse back above it, effectively trapping sellers and confirming a shakeout of weak hands.
This internal Wyckoff structure within the falling wedge significantly strengthens the case for institutional accumulation taking place.
Bullish Candlestick & Oscillator Confluence:
At the recent lows, we observed a potential Piercing Line bullish reversal candlestick pattern forming right at the lower trendline of the wedge. This indicates aggressive buying stepping in.
The MACD indicator has confirmed this bullish shift, showing a recent bullish crossover (MACD line above Signal line) and a flip of the histogram from red to green.
Furthermore, there appears to be a bullish divergence on the MACD – as price made lower lows within the wedge, the MACD indicator made higher lows (or showed increasing bullish momentum), suggesting underlying bearish momentum is weakening significantly.
Market Sentiment & Potential Implications:
It's noteworthy that this bullish technical setup is occurring amidst increased bearish media and Twitter sentiment surrounding oil. From a contrarian perspective, extreme bearish sentiment often coincides with market bottoms, as "smart money" accumulates positions while the crowd is most pessimistic. This situation could set the stage for a strong reversal, potentially fueled by short covering.
Conclusion:
All signs from price action, volume, candlestick patterns, and oscillators point towards a high probability of a bullish reversal and an upside breakout from this well-formed falling wedge. The potential Wyckoff accumulation pattern adds significant weight to the idea that sophisticated players are positioning for a significant move higher.
What to Watch For:
The next critical step is a decisive breakout above the upper trendline of the falling wedge, ideally accompanied by a significant surge in buying volume. This would confirm the pattern's completion and signal the potential start of a new uptrend. A more aggressive approach is entering now and capturing more upside if it is to occur.
This is for educational purposes only and not financial advice. Always conduct your own research and manage your risk.
Looking at the daily chart for Crude Oil, we appear to be seeing a very compelling confluence of bullish technical signals that suggest a potential significant reversal to the upside.
Textbook Falling Wedge Formation:
Price action is clearly consolidating within a well-defined falling wedge pattern.
We have observed multiple clear touches (3+ on the upper, 4+ on the lower trendline), indicating these boundaries are highly respected by the market.
Crucially, volume has been declining as price consolidates within the wedge, a classic characteristic signifying diminishing selling pressure.
The angles of convergence also appear ideal, with the upper trendline being steeper than the lower.
Wyckoff Accumulation Schematic #1 in Play?
Diving deeper, the internal structure of this falling wedge strongly resembles Wyckoff's Accumulation Schematic #1.
We can identify potential phases:
PS (Preliminary Support): Early signs of buying.
SC (Selling Climax): A sharp sell-off often with high volume, marking potential capitulation.
AR (Automatic Rally): The first significant bounce after the SC.
ST (Secondary Test): Retesting the lows of the SC.
Spring: A key event where price dips below the established trading range support (or the wedge's lower trendline) only to quickly reverse back above it, effectively trapping sellers and confirming a shakeout of weak hands.
This internal Wyckoff structure within the falling wedge significantly strengthens the case for institutional accumulation taking place.
Bullish Candlestick & Oscillator Confluence:
At the recent lows, we observed a potential Piercing Line bullish reversal candlestick pattern forming right at the lower trendline of the wedge. This indicates aggressive buying stepping in.
The MACD indicator has confirmed this bullish shift, showing a recent bullish crossover (MACD line above Signal line) and a flip of the histogram from red to green.
Furthermore, there appears to be a bullish divergence on the MACD – as price made lower lows within the wedge, the MACD indicator made higher lows (or showed increasing bullish momentum), suggesting underlying bearish momentum is weakening significantly.
Market Sentiment & Potential Implications:
It's noteworthy that this bullish technical setup is occurring amidst increased bearish media and Twitter sentiment surrounding oil. From a contrarian perspective, extreme bearish sentiment often coincides with market bottoms, as "smart money" accumulates positions while the crowd is most pessimistic. This situation could set the stage for a strong reversal, potentially fueled by short covering.
Conclusion:
All signs from price action, volume, candlestick patterns, and oscillators point towards a high probability of a bullish reversal and an upside breakout from this well-formed falling wedge. The potential Wyckoff accumulation pattern adds significant weight to the idea that sophisticated players are positioning for a significant move higher.
What to Watch For:
The next critical step is a decisive breakout above the upper trendline of the falling wedge, ideally accompanied by a significant surge in buying volume. This would confirm the pattern's completion and signal the potential start of a new uptrend. A more aggressive approach is entering now and capturing more upside if it is to occur.
This is for educational purposes only and not financial advice. Always conduct your own research and manage your risk.
交易進行
The gold/oil ratio historically goes to 10 barrels of oil per 1 ounce of gold after it peaks. I believe we have peaked, but even if we have not peaked yet, the ratio will eventually normalize.That means, in the most bearish scenario, where gold falls from 3300 to 1700, then you 1700/10 = $170 oil
If gold remains 3000+ then 3000/10 = $300 oil.
the silver to oil ratio is also at its historic high range, suggesting the same as the gold/oil ratio.
註釋
High Volume break of wedge, would like to see more of a breakout but this is pretty much what to look for...免責聲明
這些資訊和出版物並不意味著也不構成TradingView提供或認可的金融、投資、交易或其他類型的意見或建議。請在使用條款閱讀更多資訊。