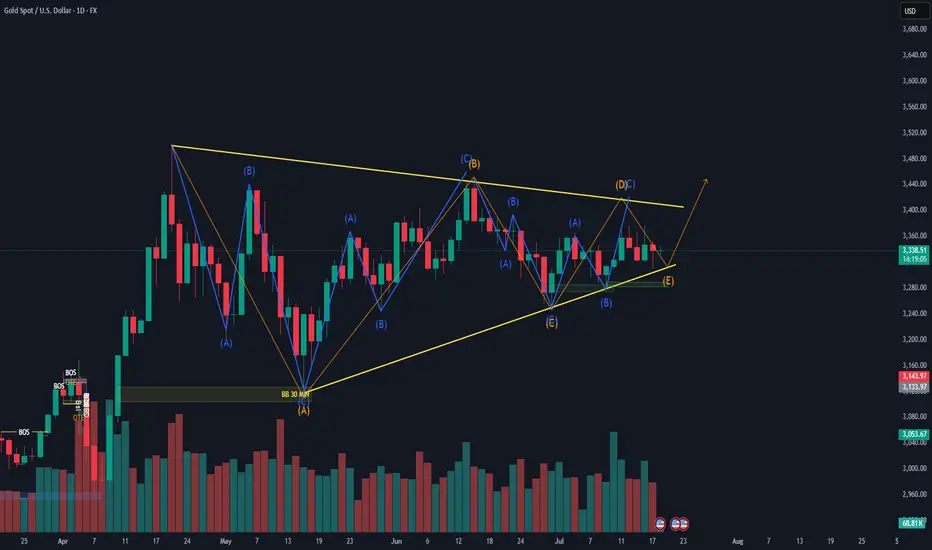
Symmetrical Triangle Correction – Elliott Wave Perspective
The image depicts a Symmetrical Triangle Correction, a common corrective pattern in Elliott Wave Theory. This formation is typically observed during wave 4 or within a complex correction, and it signals consolidation before the next impulsive move.
Structure:
A symmetrical triangle is composed of five corrective waves, labeled A-B-C-D-E.
Each wave itself is subdivided into a-b-c zigzag patterns, indicating a 3-3-3-3-3 structure.
The triangle is bounded by two converging trendlines—one sloping downwards and the other upwards—forming a symmetrical shape.
Key Characteristics:
Occurs after a strong impulse, representing a period of indecision or balance between bulls and bears.
Volume typically contracts during the triangle formation.
The triangle resolves in the direction of the prior trend, meaning this is usually a continuation pattern.
Each leg (A to E) gets progressively smaller, reflecting decreasing volatility.
Market Psychology:
Wave A: Initial reaction to overextension in the previous move.
Wave B: Market attempts to resume the trend but fails.
Wave C: Bears regain strength but with less momentum.
Wave D: Bulls push again, but still no breakout.
Wave E: Final shakeout before breakout.
Trading Implication:
A breakout often occurs after wave E, confirming the end of the correction.
Traders may enter positions in the direction of the prior trend with a stop below/above wave E, targeting a move equal to the widest part of the triangle.
免責聲明
這些資訊和出版物並不意味著也不構成TradingView提供或認可的金融、投資、交易或其他類型的意見或建議。請在使用條款閱讀更多資訊。
免責聲明
這些資訊和出版物並不意味著也不構成TradingView提供或認可的金融、投資、交易或其他類型的意見或建議。請在使用條款閱讀更多資訊。