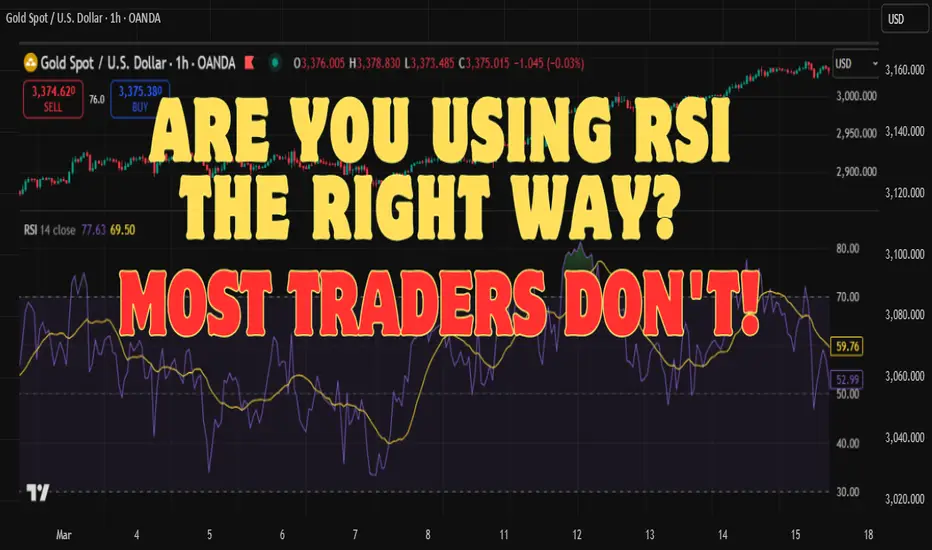
🧠 Are You Using RSI the Right Way? Most Traders Don't!
When we talk about the RSI (Relative Strength Index), most traders only look at the traditional levels — overbought at 70 and oversold at 30. But that’s only scratching the surface.
💡 Here’s the real power of RSI:
✅ Bullish Bias Above 50
❌ Bearish Bias Below 50
Let me explain 👇
📊 Traditional Way (Often Misleading):
Most beginners buy when RSI is below 30 (thinking it’s oversold) and sell when RSI is above 70 (thinking it’s overbought).
But markets can stay oversold or overbought for a long time — leading to early entries or false signals.
⚡ Smarter Way — Focus on the RSI Mid-Level (50):
* When RSI is above 50, momentum favors the bulls — it’s better to look for long setups.

* When RSI is below 50, momentum favors the bears — better to focus on short opportunities.

This approach helps you stay in sync with the dominant market trend and improves your trading timing.
🎯 Tip: Use RSI 50-level as a trend filter for your strategy. Combine it with price action or moving averages for stronger entries.
📌 Try it out on your favorite stock, crypto, or forex pair and see the difference for yourself.
💬 Let me know in the comments: Were you using RSI the right way before this?
Disclaimer :
This post is not financial advice, it's for educational purposes only highlighting the power of indicators and tools available in TradingView.
When we talk about the RSI (Relative Strength Index), most traders only look at the traditional levels — overbought at 70 and oversold at 30. But that’s only scratching the surface.
💡 Here’s the real power of RSI:
✅ Bullish Bias Above 50
❌ Bearish Bias Below 50
Let me explain 👇
📊 Traditional Way (Often Misleading):
Most beginners buy when RSI is below 30 (thinking it’s oversold) and sell when RSI is above 70 (thinking it’s overbought).
But markets can stay oversold or overbought for a long time — leading to early entries or false signals.
⚡ Smarter Way — Focus on the RSI Mid-Level (50):
* When RSI is above 50, momentum favors the bulls — it’s better to look for long setups.
* When RSI is below 50, momentum favors the bears — better to focus on short opportunities.
This approach helps you stay in sync with the dominant market trend and improves your trading timing.
🎯 Tip: Use RSI 50-level as a trend filter for your strategy. Combine it with price action or moving averages for stronger entries.
📌 Try it out on your favorite stock, crypto, or forex pair and see the difference for yourself.
💬 Let me know in the comments: Were you using RSI the right way before this?
Disclaimer :
This post is not financial advice, it's for educational purposes only highlighting the power of indicators and tools available in TradingView.
Shivam mandai
免責聲明
這些資訊和出版物並不意味著也不構成TradingView提供或認可的金融、投資、交易或其他類型的意見或建議。請在使用條款閱讀更多資訊。
Shivam mandai
免責聲明
這些資訊和出版物並不意味著也不構成TradingView提供或認可的金融、投資、交易或其他類型的意見或建議。請在使用條款閱讀更多資訊。