Key Technical Insights (Gold)
1) Fibonacci Confluence Zone:
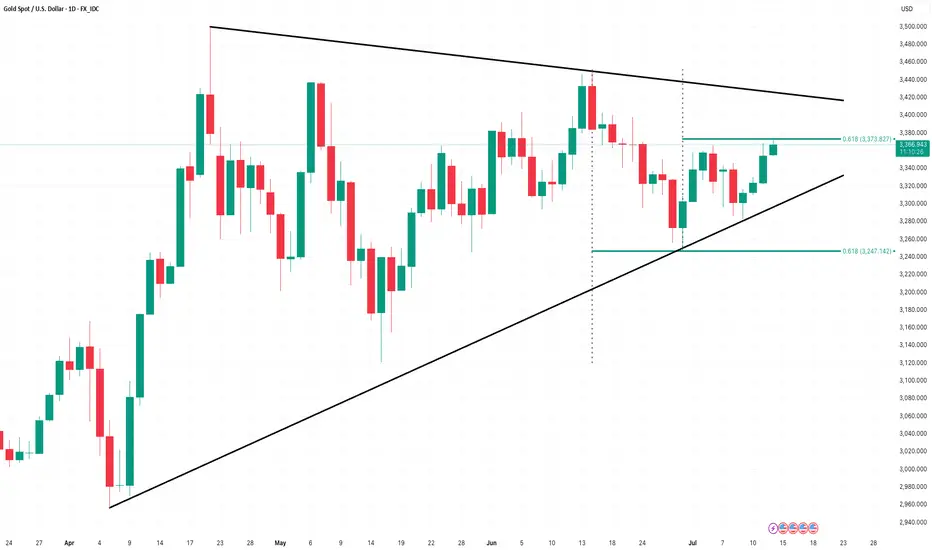
Now gold price action is currently compressed between two overlapping 61.8% Fibonacci retracement levels:
- Swing Low Retracement (61.8%) from the prior downtrend leg
- Swing High Retracement (61.8%) from the recent bullish move
This dual Fibonacci alignment reflects a high tension equilibrium between bullish and bearish forces, a typical precursor to breakout volatility.
2) Chart Pattern – Symmetrical Triangle:
Price is also developing a symmetrical triangle pattern, signaling a period of consolidation and potential energy buildup.
This structure usually leads to a breakout in the direction of the prevailing longer-term trend, which in this case remains bullish.
3) Momentum & Volatility:
RSI is holding in the mid-50s range — confirming market indecision.
Volume is contracting, consistent with the compression phase before expansion.
4) Mid-Term Outlook: Bullish Bias with Caution
Based on current technical conditions and macroeconomic context, the mid-term outlook for gold remains bullish, but requires patience and confirmation.
5) Strategic Levels to Watch:
- Breakout zone: $3,375 – $3,385
- Upside targets (if breakout holds): $3,435 → $3,495 → $3,520
- Bearish invalidation: Break below $3,240 would negate this bullish setup.
Gold is currently at a critical decision point compressed between technical resistance and structural support, forming a triangle at Fibonacci confluence. While the breakout direction is yet to be confirmed, probability favors a bullish resolution in alignment with the macro uptrend.
Traders and investors should remain patient, wait for confirmation, and manage risk accordingly.
1) Fibonacci Confluence Zone:
Now gold price action is currently compressed between two overlapping 61.8% Fibonacci retracement levels:
- Swing Low Retracement (61.8%) from the prior downtrend leg
- Swing High Retracement (61.8%) from the recent bullish move
This dual Fibonacci alignment reflects a high tension equilibrium between bullish and bearish forces, a typical precursor to breakout volatility.
2) Chart Pattern – Symmetrical Triangle:
Price is also developing a symmetrical triangle pattern, signaling a period of consolidation and potential energy buildup.
This structure usually leads to a breakout in the direction of the prevailing longer-term trend, which in this case remains bullish.
3) Momentum & Volatility:
RSI is holding in the mid-50s range — confirming market indecision.
Volume is contracting, consistent with the compression phase before expansion.
4) Mid-Term Outlook: Bullish Bias with Caution
Based on current technical conditions and macroeconomic context, the mid-term outlook for gold remains bullish, but requires patience and confirmation.
5) Strategic Levels to Watch:
- Breakout zone: $3,375 – $3,385
- Upside targets (if breakout holds): $3,435 → $3,495 → $3,520
- Bearish invalidation: Break below $3,240 would negate this bullish setup.
Gold is currently at a critical decision point compressed between technical resistance and structural support, forming a triangle at Fibonacci confluence. While the breakout direction is yet to be confirmed, probability favors a bullish resolution in alignment with the macro uptrend.
Traders and investors should remain patient, wait for confirmation, and manage risk accordingly.
免責聲明
這些資訊和出版物並不意味著也不構成TradingView提供或認可的金融、投資、交易或其他類型的意見或建議。請在使用條款閱讀更多資訊。