📊 Market Sentiment and Price Structure Overview:
Gold has been navigating a highly structured range with multiple clear zones of support and resistance that have now started to break down in favor of a short-term bullish trend. The chart reflects a transition from a bearish descending channel to a potential bullish continuation pattern.
Today’s analysis is centered around three core ideas:
Market Structure Shift (Break of structure)
Support/Resistance Interchange (horizontal + channel)
Trendline Dynamics (bullish control)
Each of these plays a key role in shaping trade bias and decision-making.
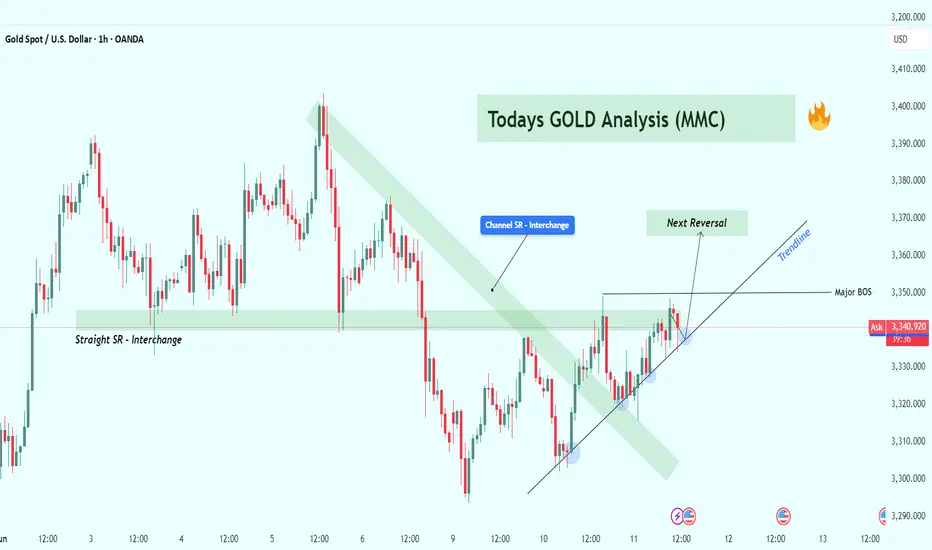
🧱 1. Straight SR Interchange Zone (Key Historical Level):
Marked on the left side of the chart, this level has acted as both support and resistance over the last several days. Traders call this a “flip zone” — price often bounces off this area multiple times as buyers and sellers wrestle for dominance.
✅ Multiple touches indicate institutional interest.
🔄 This zone adds confluence to other structure zones, increasing its strength.
🧲 Price currently hovers near this level, suggesting indecision or a setup for a larger move.
📉 2. Descending Channel SR Flip – Confirmation of Shift:
The descending green channel served as a dynamic resistance over multiple sessions. Price remained below it during the previous downtrend. However, a breakout occurred, followed by a successful retest, turning it into support — a textbook bullish structure flip.
This move was also a signal of trend reversal, which was followed by higher lows and a shift in price behavior.
📈 3. Upward Trendline – Short-Term Bullish Control:
A diagonal ascending trendline is forming beneath price action, supported by multiple rejection wicks and higher lows (marked in blue). This shows that buyers are stepping in earlier, absorbing selling pressure.
🔁 Each touch confirms strength.
📉 A break below this line could signal weakness or trend exhaustion.
Watch closely — this line becomes your dynamic support and invalidation point for any long positions.
🔄 4. Major BOS (Break of Structure) – Trend Change Confirmed:
We’ve seen a clean break of structure above previous swing highs — this is key in market structure analysis. When a lower high is invalidated by a higher high, it often marks a trend reversal.
This BOS now acts as a major support area. As long as price remains above this zone, bullish continuation is favored.
🚨 5. Reversal Zone in Sight – Potential Resistance Ahead:
Highlighted as “Next Reversal” in the chart, this area around $3,360–$3,370 is a confluence of:
Past resistance
Mid-channel region
Psychological round numbers
Price is nearing this level, and we may see a temporary pullback or rejection before any further continuation.
🎯 Trading Plan:
🔵 BULLISH SCENARIO (Base Case):
🟢 Entry: On a retest of trendline or BOS zone ($3,330–$3,340)
🛡️ SL: Below $3,325
🎯 TP1: $3,360
🎯 TP2: $3,390
🧠 Reasoning: Structural shift confirmed, trendline respected, SR flip confluence.
🔴 BEARISH SCENARIO (Counter-Play):
🔴 Entry: At rejection from $3,365–$3,370 zone (reversal box)
🛡️ SL: Above $3,380
🎯 TP1: $3,345
🎯 TP2: $3,330
🧠 Reasoning: Reversal from resistance zone, potential trap setup, fading exhausted move.
📌 Summary:
Gold is in a key decision phase after a major structural flip. The battle between bulls and bears is now centered around the trendline and next resistance zone. As always, patience and confirmation will be key.
Trendline = dynamic support
BOS zone = structural support
Reversal area = possible short-term ceiling
💡 Best trades will come from reactions, not predictions.
🚀 Stay Updated:
Follow this idea for live updates as price reacts to these zones. If we break and hold above the reversal box, expect bullish continuation. Otherwise, watch for potential trap plays and short-term pullbacks.
Gold has been navigating a highly structured range with multiple clear zones of support and resistance that have now started to break down in favor of a short-term bullish trend. The chart reflects a transition from a bearish descending channel to a potential bullish continuation pattern.
Today’s analysis is centered around three core ideas:
Market Structure Shift (Break of structure)
Support/Resistance Interchange (horizontal + channel)
Trendline Dynamics (bullish control)
Each of these plays a key role in shaping trade bias and decision-making.
🧱 1. Straight SR Interchange Zone (Key Historical Level):
Marked on the left side of the chart, this level has acted as both support and resistance over the last several days. Traders call this a “flip zone” — price often bounces off this area multiple times as buyers and sellers wrestle for dominance.
✅ Multiple touches indicate institutional interest.
🔄 This zone adds confluence to other structure zones, increasing its strength.
🧲 Price currently hovers near this level, suggesting indecision or a setup for a larger move.
📉 2. Descending Channel SR Flip – Confirmation of Shift:
The descending green channel served as a dynamic resistance over multiple sessions. Price remained below it during the previous downtrend. However, a breakout occurred, followed by a successful retest, turning it into support — a textbook bullish structure flip.
This move was also a signal of trend reversal, which was followed by higher lows and a shift in price behavior.
📈 3. Upward Trendline – Short-Term Bullish Control:
A diagonal ascending trendline is forming beneath price action, supported by multiple rejection wicks and higher lows (marked in blue). This shows that buyers are stepping in earlier, absorbing selling pressure.
🔁 Each touch confirms strength.
📉 A break below this line could signal weakness or trend exhaustion.
Watch closely — this line becomes your dynamic support and invalidation point for any long positions.
🔄 4. Major BOS (Break of Structure) – Trend Change Confirmed:
We’ve seen a clean break of structure above previous swing highs — this is key in market structure analysis. When a lower high is invalidated by a higher high, it often marks a trend reversal.
This BOS now acts as a major support area. As long as price remains above this zone, bullish continuation is favored.
🚨 5. Reversal Zone in Sight – Potential Resistance Ahead:
Highlighted as “Next Reversal” in the chart, this area around $3,360–$3,370 is a confluence of:
Past resistance
Mid-channel region
Psychological round numbers
Price is nearing this level, and we may see a temporary pullback or rejection before any further continuation.
🎯 Trading Plan:
🔵 BULLISH SCENARIO (Base Case):
🟢 Entry: On a retest of trendline or BOS zone ($3,330–$3,340)
🛡️ SL: Below $3,325
🎯 TP1: $3,360
🎯 TP2: $3,390
🧠 Reasoning: Structural shift confirmed, trendline respected, SR flip confluence.
🔴 BEARISH SCENARIO (Counter-Play):
🔴 Entry: At rejection from $3,365–$3,370 zone (reversal box)
🛡️ SL: Above $3,380
🎯 TP1: $3,345
🎯 TP2: $3,330
🧠 Reasoning: Reversal from resistance zone, potential trap setup, fading exhausted move.
📌 Summary:
Gold is in a key decision phase after a major structural flip. The battle between bulls and bears is now centered around the trendline and next resistance zone. As always, patience and confirmation will be key.
Trendline = dynamic support
BOS zone = structural support
Reversal area = possible short-term ceiling
💡 Best trades will come from reactions, not predictions.
🚀 Stay Updated:
Follow this idea for live updates as price reacts to these zones. If we break and hold above the reversal box, expect bullish continuation. Otherwise, watch for potential trap plays and short-term pullbacks.
免責聲明
這些資訊和出版物並不意味著也不構成TradingView提供或認可的金融、投資、交易或其他類型的意見或建議。請在使用條款閱讀更多資訊。