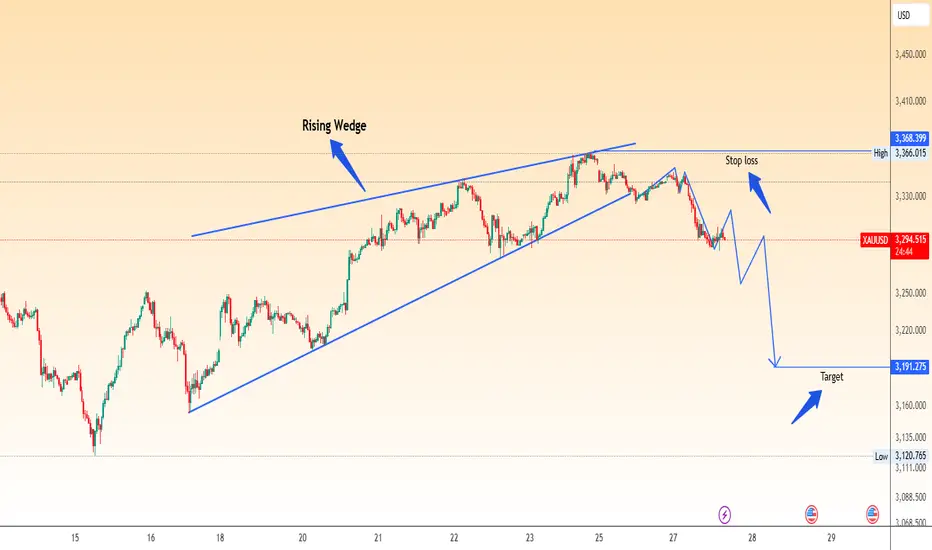
📉 Technical Pattern: Rising Wedge (Bearish Reversal)
The chart illustrates a Rising Wedge formation that has developed over the past several sessions. This pattern is typically a bearish reversal signal, especially when it appears after an extended uptrend.
In this case:
The wedge was clearly broken to the downside, signaling a potential shift in momentum from bullish to bearish.
A retest of the wedge’s lower boundary or nearby resistance has occurred (or is anticipated), offering a possible entry point for short positions.
💼 Trade Setup:
Entry Zone: Near the retest of the wedge breakdown (~$3,295–$3,310)
Stop Loss: Above the recent swing high / top of wedge (~$3,366)
Take Profit Target: $3,191.275 (based on prior horizontal support and technical projection)
📊 Price Action & Confirmation:
Price has already started forming lower highs and lower lows post-breakout.
The downside momentum is building, and the rejection near the wedge resistance supports the bearish continuation idea.
Potential short-term consolidation or pullback may occur before the move continues downward.
🎯 Target Justification:
The target aligns with:
Previous structure support (visible consolidation zone)
Potential measured move projection from the wedge height
Psychological round-number zone near $3,190
🛑 Risk Management:
Always follow strict risk management principles. The Risk-Reward Ratio here appears favorable (>2:1), depending on entry precision.
🔍 Summary:
This setup presents a high-probability short opportunity on XAU/USD following a Rising Wedge breakdown. Bearish bias remains valid below the $3,330–$3,366 zone. Traders should monitor for any bullish invalidation signals or unexpected fundamental catalysts (e.g., U.S. economic news, Fed comments)
免責聲明
這些資訊和出版物並不意味著也不構成TradingView提供或認可的金融、投資、交易或其他類型的意見或建議。請在使用條款閱讀更多資訊。