Versus the US dollar, spot gold (XAU/USD) rallied strongly in the early hours of the US session and is now up 1.5% on the day. Currently trading at US$2,977 and refreshing record highs, the precious metal is on the cusp of bumping heads with the widely watched US$3,000 level.
Gold’s Uptrend Remains Intact
Although Gold’s multi-year uptrend is not ensured to continue, from a technical perspective, the trend remains unbroken until demonstrated otherwise. And, right now, buyers are certainly in the driving seat. Some analysts use moving averages to indicate a trend change, while others use technical indicators; I prefer good old-fashioned price action to help validate a trend reversal, and I have seen limited evidence thus far.
Bulls Targeting US$3,000?
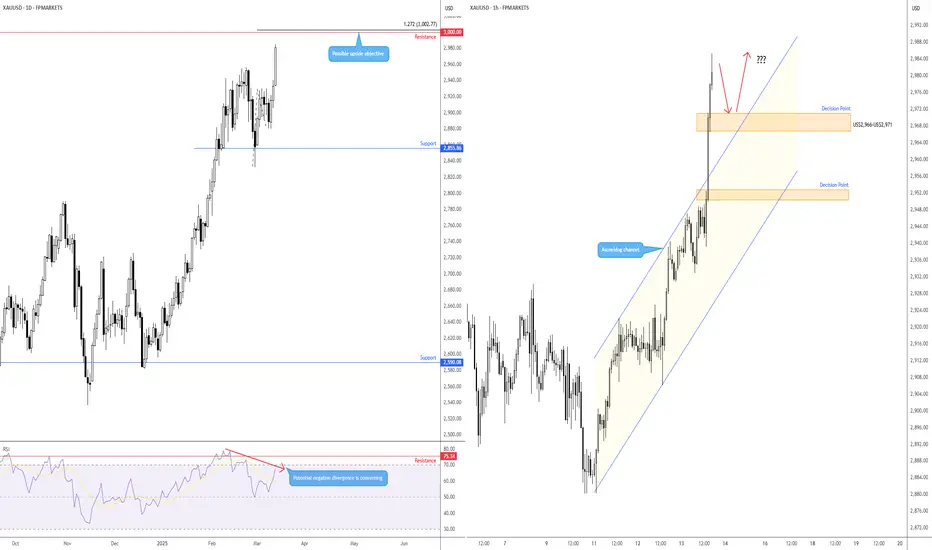
The daily chart shows that price action is fast approaching the US$3,000 barrier, with a 1.272% Fibonacci projection ratio circling just above at US$3,002. While this Fibonacci projection ratio is essentially an ‘alternate’ AB=CD bearish structure, I tend only to consider these patterns in downtrends, employing them to help confirm and fade a pullback. However, that is not to say that they cannot be used as profit objectives/potential resistance levels in uptrends. Consequently, given possible negative divergence from the Relative Strength Index, the US$3,000 area could prompt profit-taking.
With the above in mind, until the yellow metal reaches US$3,000, this could open the door to short-term bullish scenarios. The H1 decision point area at US$2,966-US$2,971 is a zone I will watch closely for bulls to make a show from in the event price tests this space. Interestingly, this base is accompanied by a H1 channel resistance-turned potential resistance, extended from the high of US$2,922.
Written by FP Markets Market Analyst Aaron Hill
Gold’s Uptrend Remains Intact
Although Gold’s multi-year uptrend is not ensured to continue, from a technical perspective, the trend remains unbroken until demonstrated otherwise. And, right now, buyers are certainly in the driving seat. Some analysts use moving averages to indicate a trend change, while others use technical indicators; I prefer good old-fashioned price action to help validate a trend reversal, and I have seen limited evidence thus far.
Bulls Targeting US$3,000?
The daily chart shows that price action is fast approaching the US$3,000 barrier, with a 1.272% Fibonacci projection ratio circling just above at US$3,002. While this Fibonacci projection ratio is essentially an ‘alternate’ AB=CD bearish structure, I tend only to consider these patterns in downtrends, employing them to help confirm and fade a pullback. However, that is not to say that they cannot be used as profit objectives/potential resistance levels in uptrends. Consequently, given possible negative divergence from the Relative Strength Index, the US$3,000 area could prompt profit-taking.
With the above in mind, until the yellow metal reaches US$3,000, this could open the door to short-term bullish scenarios. The H1 decision point area at US$2,966-US$2,971 is a zone I will watch closely for bulls to make a show from in the event price tests this space. Interestingly, this base is accompanied by a H1 channel resistance-turned potential resistance, extended from the high of US$2,922.
Written by FP Markets Market Analyst Aaron Hill
免責聲明
這些資訊和出版物並不意味著也不構成TradingView提供或認可的金融、投資、交易或其他類型的意見或建議。請在使用條款閱讀更多資訊。