1.The chart is showing a series of higher highs and higher lows, indicating an overall uptrend.
2. *Price is above the 20-day MA - Typically a bullish signal.
* (50-day and 89-day MA) are trending upwards and far below the current price, reinforcing a longer-term bullish trend.
Recent Candlestick Action: A strong bullish candle recently bounced off the blue MA after a short consolidation, suggesting buyers stepped in to the pullback. The last candles shows upward momentum resuming, possibly forming a Bullish continuation pattern. The RSI seems to be trending slightly down or flat not yet in overbought territory.
The technicals favor further upside in the short term to medium term, especially if the recent bullish candle closes strong. A break above the recent highs would confirm continuation, while a failure there could mean a short-term pullback.
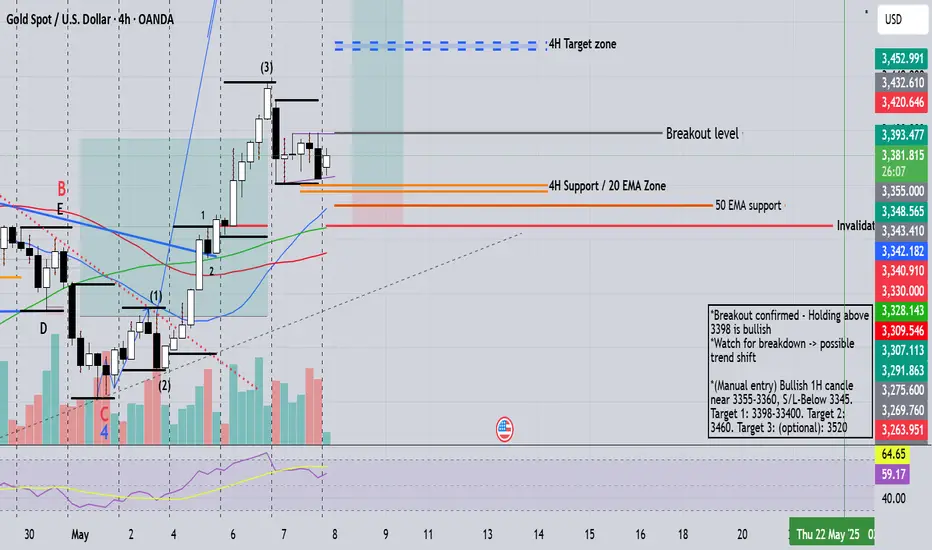
After the late- April peak and pullback, the market formed a higher low, followed by a strong bullish rally from May 3rd onward. Current candles are consolidating after a sharp move - showing healthy digestion of gains. No strong bearish reversal patterns are visible yet.
Volume increased during the May 3-6 rally - a good sigh of strength behind the move. Slight decrease in volume on the latest candles, suggest consolidation rather than distribution.
RSI is rising but not yet in overbought territory - Room for upside remains. Watch if RSI diverge while price pushes up - that could signal exhaustion.
Warning sign : Drop below 2240 and break below EMAs would shift bias neutral to bearish.
4h Price Structure : after forming a double bottom or rounded base near April 30 - May 2, price pushed up strongly. It`s now consolidating just under the recent highs, forming a bullish flag or tight range, suggesting a potential breakout.
Risk Level To Watch: A break below 3345 (near the 59 EMA and previous range) would invalidate this short-term target and signal weakness.
2. *Price is above the 20-day MA - Typically a bullish signal.
* (50-day and 89-day MA) are trending upwards and far below the current price, reinforcing a longer-term bullish trend.
Recent Candlestick Action: A strong bullish candle recently bounced off the blue MA after a short consolidation, suggesting buyers stepped in to the pullback. The last candles shows upward momentum resuming, possibly forming a Bullish continuation pattern. The RSI seems to be trending slightly down or flat not yet in overbought territory.
The technicals favor further upside in the short term to medium term, especially if the recent bullish candle closes strong. A break above the recent highs would confirm continuation, while a failure there could mean a short-term pullback.
After the late- April peak and pullback, the market formed a higher low, followed by a strong bullish rally from May 3rd onward. Current candles are consolidating after a sharp move - showing healthy digestion of gains. No strong bearish reversal patterns are visible yet.
Volume increased during the May 3-6 rally - a good sigh of strength behind the move. Slight decrease in volume on the latest candles, suggest consolidation rather than distribution.
RSI is rising but not yet in overbought territory - Room for upside remains. Watch if RSI diverge while price pushes up - that could signal exhaustion.
Warning sign : Drop below 2240 and break below EMAs would shift bias neutral to bearish.
4h Price Structure : after forming a double bottom or rounded base near April 30 - May 2, price pushed up strongly. It`s now consolidating just under the recent highs, forming a bullish flag or tight range, suggesting a potential breakout.
Risk Level To Watch: A break below 3345 (near the 59 EMA and previous range) would invalidate this short-term target and signal weakness.
免責聲明
這些資訊和出版物並不意味著也不構成TradingView提供或認可的金融、投資、交易或其他類型的意見或建議。請在使用條款閱讀更多資訊。