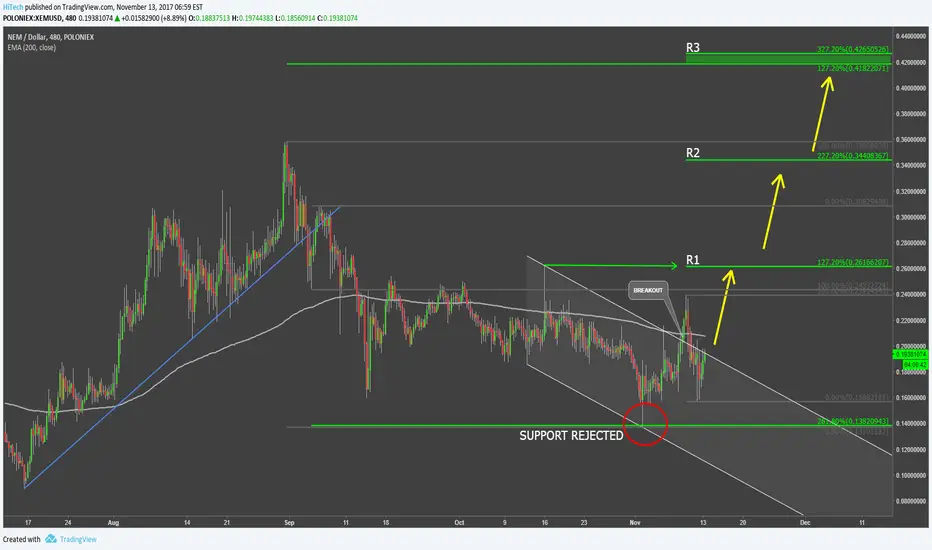
After a strong correction from $0.358 down to $0.138, with a total loss of 60%, NEM finally found the support at 261.8% Fibonacci retracement level applied to the corrective wave after the uptrend trendline breakout.
Further, XEM/USD broke above the descending channel as well as 200 Moving Average. These are pretty strong signals of a potential end of the corrective wave and continuation of a long-term uptrend.
Upside targets are based on Fibonacci levels applied to the corrective wave after the descending channel breakout. First $0.26, second $0.35 and final and the strongest upside resistance at $0.42 area, that corresponds with two Fibonacci levels.
A move lower than $0.138 would invalidate this forecast and could result in the continuation of the downside correction or a consolidation.
註釋
Volume increasing, going up...註釋
First target reached交易結束:目標達成
註釋
Resistance broken so more upside potential is there, will try to analyse and see what are the targets註釋
Here is the update on Nem 
免責聲明
這些資訊和出版物並不意味著也不構成TradingView提供或認可的金融、投資、交易或其他類型的意見或建議。請在使用條款閱讀更多資訊。
免責聲明
這些資訊和出版物並不意味著也不構成TradingView提供或認可的金融、投資、交易或其他類型的意見或建議。請在使用條款閱讀更多資訊。