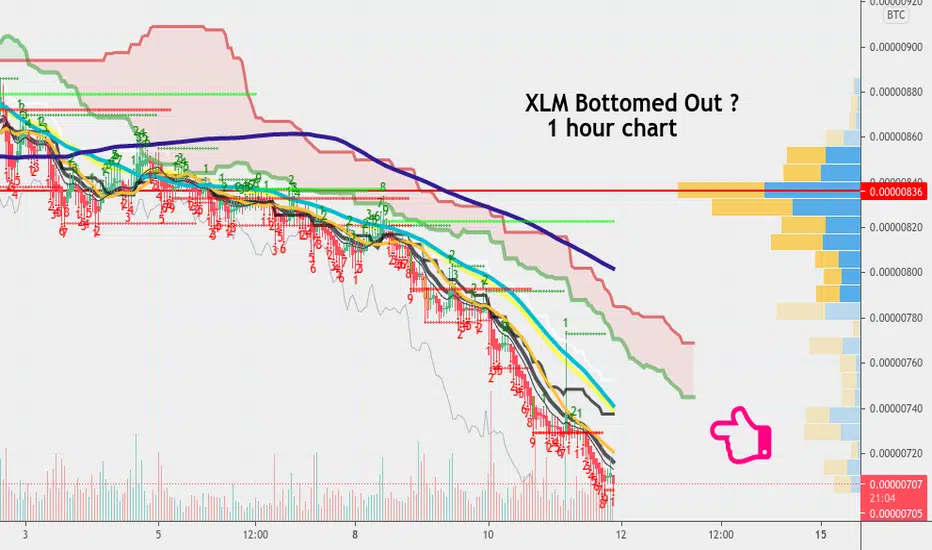
Here we see our XLM Btc 1 hour chart on Binance . As you see we have dipped way down here into the 700 area. We have hit another TD Sequential 9 in red here and should really see a turnaround come soon . I'd wait for confirmation but a target above us seems to be 836 - which would be that red line above us. That's part of our VPVR indicator and the red line is an area of confluence and should be a target above us where we will be going at some point. I still think there is a large Cup and Handle structure forming on this XLM chart on the higher timeframes but here we see the chart is bottomed out . When this finally turns up the targets above should be our fibs which are =
1926 - that's our .236 fib
2862 - that's our .382 fib
3619 - that's our .5 fib
4375 - that's our .618 fib
4939 - that's our .786 fib
there may be a pullback somewhere near 37xx since that could be the lip of the cup - but Xlm can see returns to All Time Highs this year . Thank you.
1926 - that's our .236 fib
2862 - that's our .382 fib
3619 - that's our .5 fib
4375 - that's our .618 fib
4939 - that's our .786 fib
there may be a pullback somewhere near 37xx since that could be the lip of the cup - but Xlm can see returns to All Time Highs this year . Thank you.
😃 Join shimmeringpath's friendly free
Telegram chat here : bulls and bears both welcome !
t.me/CryptoRisingTradersChat
Telegram chat here : bulls and bears both welcome !
t.me/CryptoRisingTradersChat
相關出版品
免責聲明
這些資訊和出版物並不意味著也不構成TradingView提供或認可的金融、投資、交易或其他類型的意見或建議。請在使用條款閱讀更多資訊。
😃 Join shimmeringpath's friendly free
Telegram chat here : bulls and bears both welcome !
t.me/CryptoRisingTradersChat
Telegram chat here : bulls and bears both welcome !
t.me/CryptoRisingTradersChat
相關出版品
免責聲明
這些資訊和出版物並不意味著也不構成TradingView提供或認可的金融、投資、交易或其他類型的意見或建議。請在使用條款閱讀更多資訊。