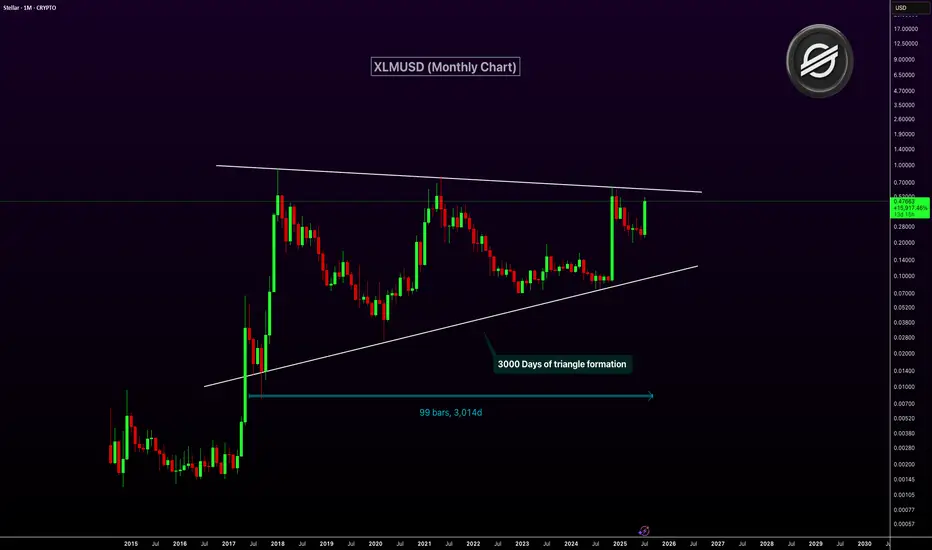
XLM has been consolidating inside a massive symmetrical triangle for over 3,000 days. This long-term pattern on the monthly chart dates back to 2017. The price is now approaching the upper resistance trendline of the triangle. A breakout from this structure could ignite a major bullish rally.
The current monthly candle shows strong momentum with over 100% gains. A confirmed breakout above resistance could mark the start of a macro uptrend. This triangle is one of the most significant technical setups in XLM’s history.
Target 1: $1.00
Target 2: $2.50
Target 3: $5.00
The current monthly candle shows strong momentum with over 100% gains. A confirmed breakout above resistance could mark the start of a macro uptrend. This triangle is one of the most significant technical setups in XLM’s history.
Target 1: $1.00
Target 2: $2.50
Target 3: $5.00
🚀Telegram : t.me/hexatrades
🌐Website: hexatrades.io/
🗣️Twitter(X): twitter.com/HexaTrades
🌐Website: hexatrades.io/
🗣️Twitter(X): twitter.com/HexaTrades
相關出版品
免責聲明
這些資訊和出版物並不意味著也不構成TradingView提供或認可的金融、投資、交易或其他類型的意見或建議。請在使用條款閱讀更多資訊。
🚀Telegram : t.me/hexatrades
🌐Website: hexatrades.io/
🗣️Twitter(X): twitter.com/HexaTrades
🌐Website: hexatrades.io/
🗣️Twitter(X): twitter.com/HexaTrades
相關出版品
免責聲明
這些資訊和出版物並不意味著也不構成TradingView提供或認可的金融、投資、交易或其他類型的意見或建議。請在使用條款閱讀更多資訊。