Ahoy traders!
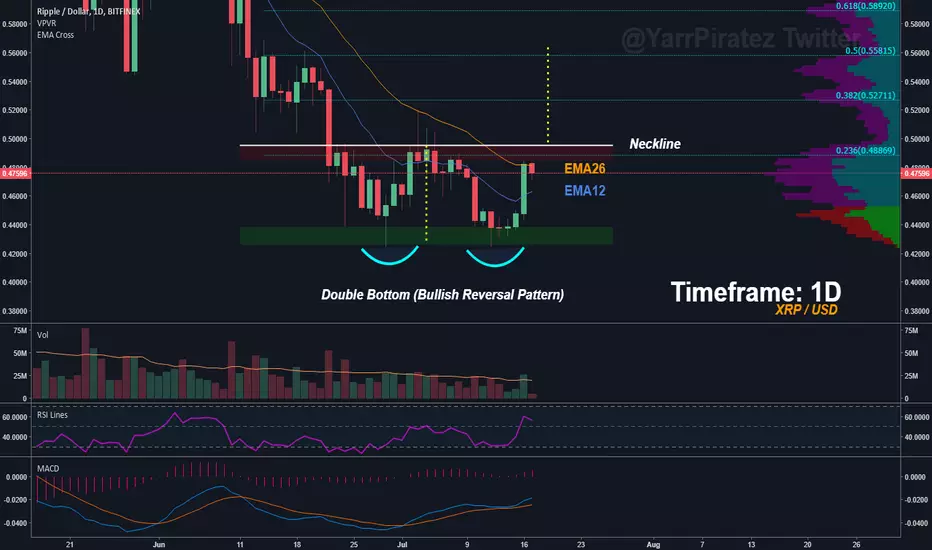
Ripple (XRP) is likely at the bottom as seen on the chart and it’s trying to form A Double Bottom Pattern. You can find this bottom usually at the very bottoms of the market. Signals for reversal. The pattern is valid only when it breaks upwards from the neckline.
Right now the price is getting rejected by the resistance zone and EMA26 level. Once it starts breaking upwards the initial target should be set at $0.55 level and partial profit should be taken at $0.53 level.
On the daily RSI needs to hold 50 level and EMAs need to cross over each other. If it does break below of EMA12 we are likely to visit support zone again.

When we are zooming out we can see that it’s sitting on the very important support level and it has higher chance to move further upward than to move downward (unless something chaotic does happen).
Trading information
Main Profit Target: $0.55
Partial Profit Target: $0.53
Note:
Targets are indicative and trading conditions may vary.
Please, if any question comes to your mind don’t hesitate to ask! I try my best to respond ASAP!
If you need help with trading, finding information or courses let me know and I’d be more than happy to help you!
Things to Remember:
Stop-loss orders are strongly recommended.
Beware of buying tops or FOMOS, you might end up losing or waiting long periods of time before getting anything back.
Do your homework before investing.
DISCLAIMER:
Please be aware this is not financial advice. You are responsible for your trading and investing decisions. It is highly recommended to do your own research before investing in anything.
Ripple (XRP) is likely at the bottom as seen on the chart and it’s trying to form A Double Bottom Pattern. You can find this bottom usually at the very bottoms of the market. Signals for reversal. The pattern is valid only when it breaks upwards from the neckline.
Right now the price is getting rejected by the resistance zone and EMA26 level. Once it starts breaking upwards the initial target should be set at $0.55 level and partial profit should be taken at $0.53 level.
On the daily RSI needs to hold 50 level and EMAs need to cross over each other. If it does break below of EMA12 we are likely to visit support zone again.
When we are zooming out we can see that it’s sitting on the very important support level and it has higher chance to move further upward than to move downward (unless something chaotic does happen).
Trading information
Main Profit Target: $0.55
Partial Profit Target: $0.53
Note:
Targets are indicative and trading conditions may vary.
Please, if any question comes to your mind don’t hesitate to ask! I try my best to respond ASAP!
If you need help with trading, finding information or courses let me know and I’d be more than happy to help you!
Things to Remember:
Stop-loss orders are strongly recommended.
Beware of buying tops or FOMOS, you might end up losing or waiting long periods of time before getting anything back.
Do your homework before investing.
DISCLAIMER:
Please be aware this is not financial advice. You are responsible for your trading and investing decisions. It is highly recommended to do your own research before investing in anything.
註釋
Broke above of the neckline!免責聲明
這些資訊和出版物並不意味著也不構成TradingView提供或認可的金融、投資、交易或其他類型的意見或建議。請在使用條款閱讀更多資訊。