i analyse this for this last move up but realy i analyse this chart for more like LRC chart when finish type and show targets i show you that chart
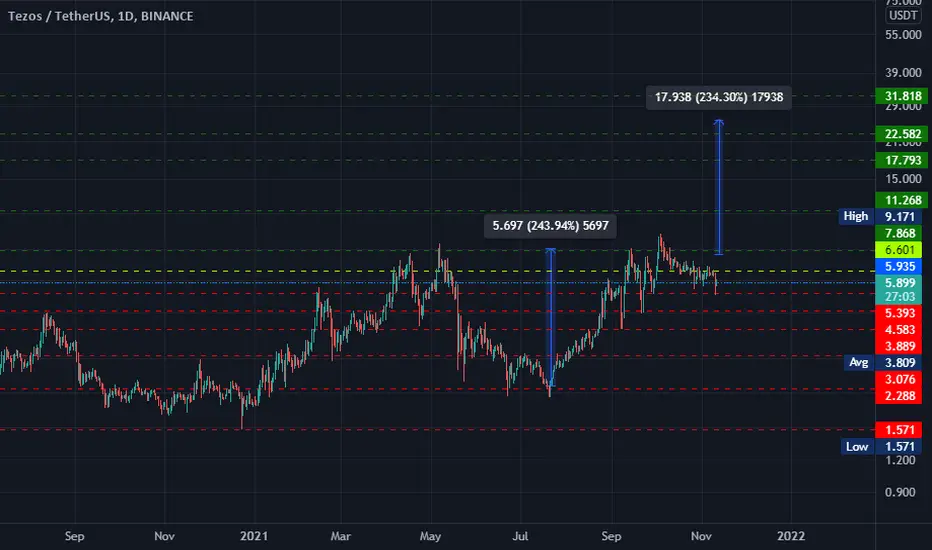
EntryPoint:
5.935
Supports:
5.393
4.583
3.889
3.076
Resistance:
6.601
Targets
7.868
11.268
17.793
22.582
31.818
GL
now watch LRC chart :
(Rememebr chart like this but fundamental difrrent and LRC going up for AXS going up)
https://www.tradingview.com/x/63H4Iy8s/
EntryPoint:
5.935
Supports:
5.393
4.583
3.889
3.076
Resistance:
6.601
Targets
7.868
11.268
17.793
22.582
31.818
GL
now watch LRC chart :
(Rememebr chart like this but fundamental difrrent and LRC going up for AXS going up)
https://www.tradingview.com/x/63H4Iy8s/
免責聲明
這些資訊和出版物並不意味著也不構成TradingView提供或認可的金融、投資、交易或其他類型的意見或建議。請在使用條款閱讀更多資訊。