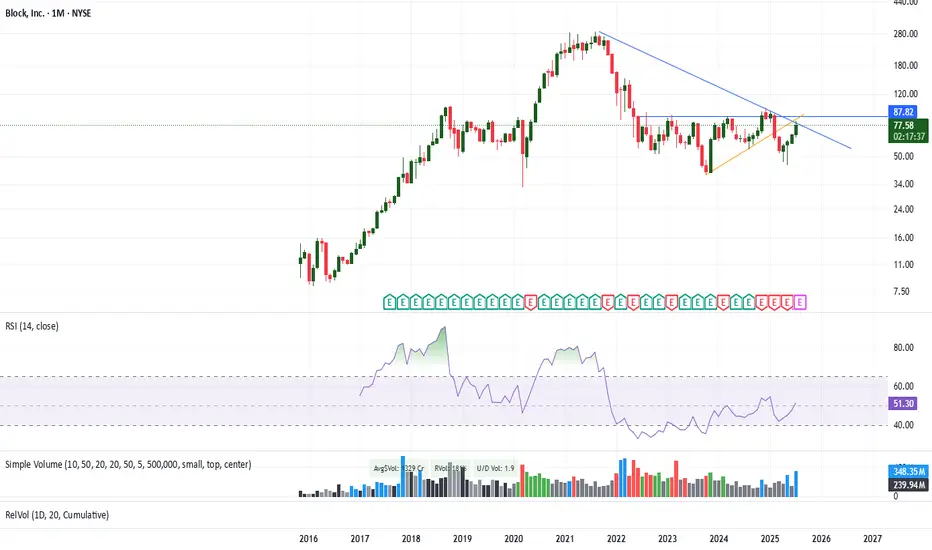
Monthly chart of XYZ shows multiple resistance points (including 200 week) are being tested, however significant volumes on 21st and 22nd July + 10week EMA crossing above 20 Week EMA, along side results day c.6th Aug make this an interesting intersection of resistance lines... am holding since the hammer created around bounce back zone.. will watch it over the next few days before exit.
交易進行
Closed position 78 (booked 25% gain)The scrip and chart remains of interest, however to rotate funds closed this position for now.
免責聲明
這些資訊和出版物並不意味著也不構成TradingView提供或認可的金融、投資、交易或其他類型的意見或建議。請在使用條款閱讀更多資訊。