https://www.tradingview.com/x/BUnHr5rb/
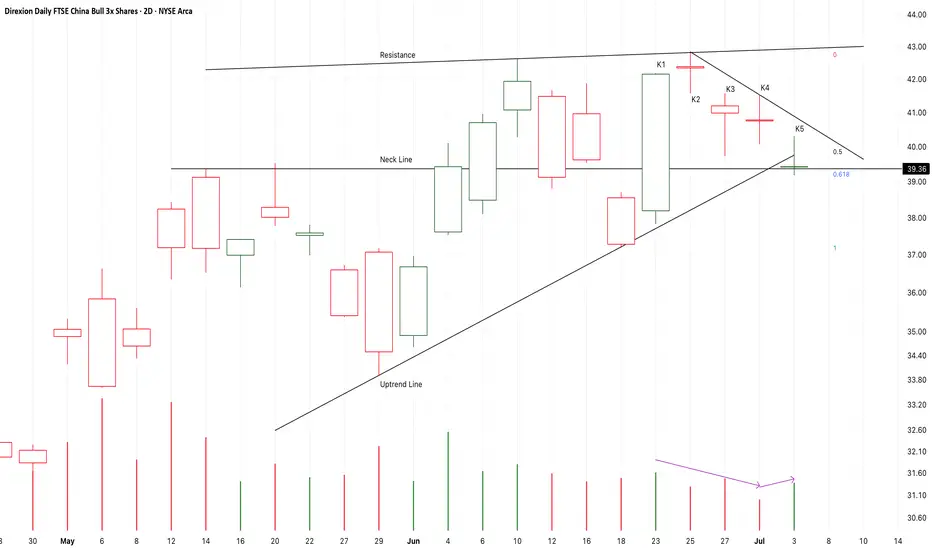
From K1 to K5,
It is a small scale consolidation or a bullish triangle pattern.
The supply pressure is decreasing too.
It seems that K6 or K7 will break up or fall down.
If the following candles close upon K3 or K4,
It is likely that another bull run will start here to test 77USD area.
On the other hand,
If the following candles close below the neck line,
The risk will sharply increase.
Long-41.6/Stop-39.9/Target-77
交易進行
From K1 to K4,
It is a potential bullish three methods pattern,
It also break up a small scale triangle pattern.
If I didn’t buy it earlier, I will try to buy it here.
The potential target at about 62-77USD at the end of this month.
免責聲明
這些資訊和出版物並不意味著也不構成TradingView提供或認可的金融、投資、交易或其他類型的意見或建議。請在使用條款閱讀更多資訊。
免責聲明
這些資訊和出版物並不意味著也不構成TradingView提供或認可的金融、投資、交易或其他類型的意見或建議。請在使用條款閱讀更多資訊。